Volume Convergence
- Indicators
- Angelo Capoferri
- Version: 1.0
- Activations: 5
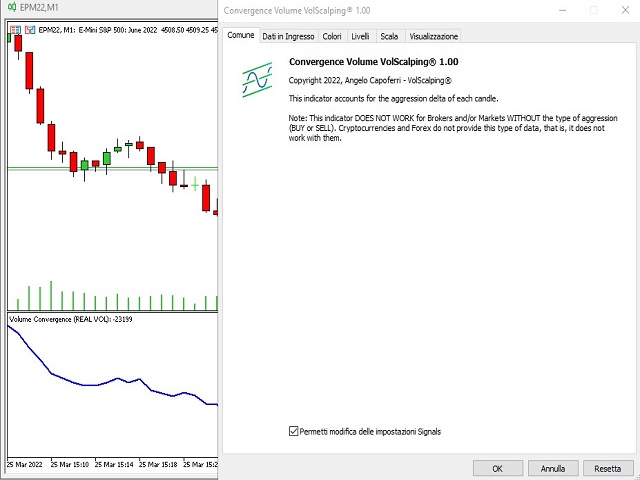
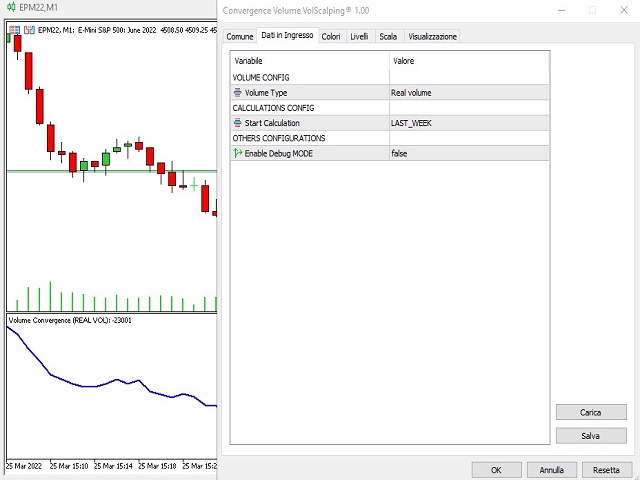
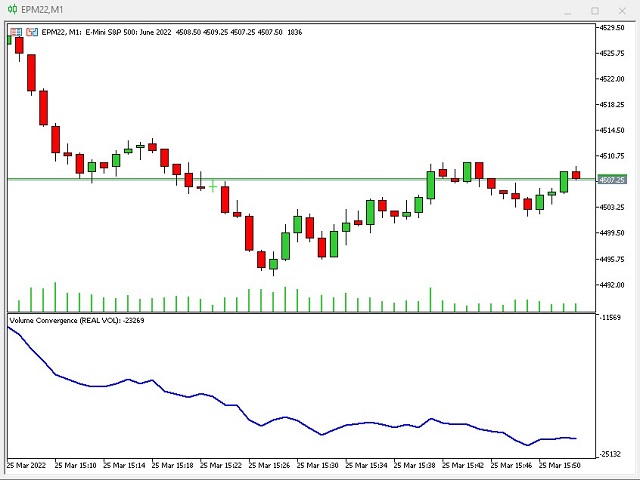
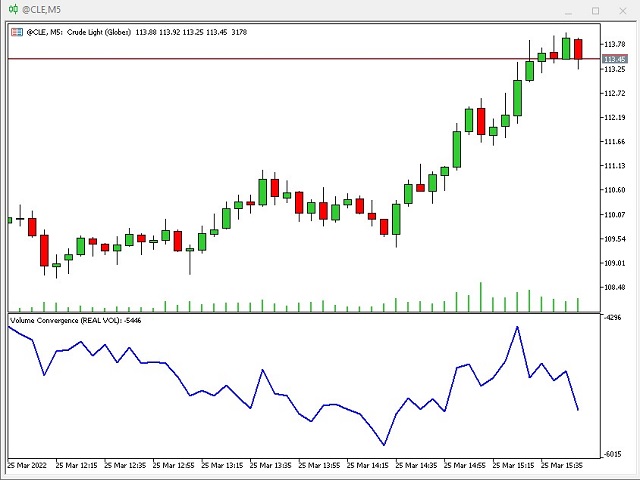
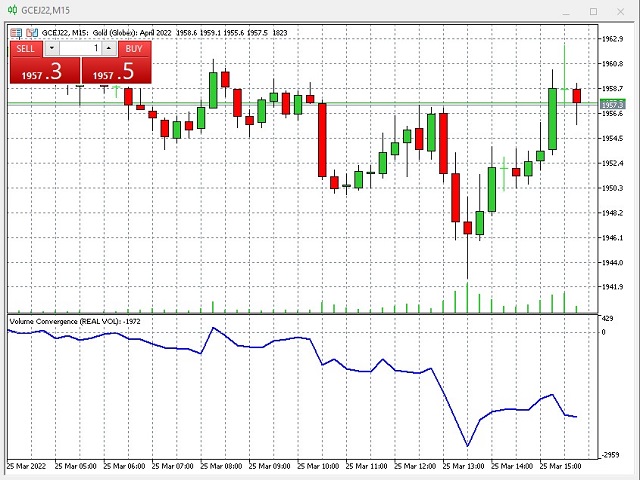
this indicator shows the strength of the real volume against the price.
if the price chart and the volume trend have the same trend, it means that everything is regular. if the indicator diverges from the price chart, it means that reversal is close.
when the price goes up and the "volume convergence" chart goes down, it means that money is exiting the market, sellers are selling on the rise and the price should soon start to plummet.
conversely, if the "volume convergence" graph goes up while the price graph goes down, it means that buyers are buying on the downsides and the price should reverse up.
the indicator must be combined with a valid trading strategy to filter the false signals of the same.
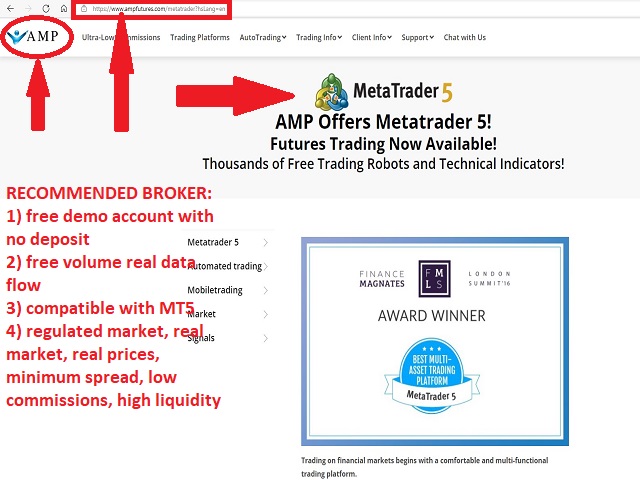
ATTENTION: the indicator works ONLY with brokers that offer the real volumetric data flow, with the splitting of the contracts struck in BID AND ASK. CFDs, CRYPTOCURRENCIES AND FOREX belong to the synthetic, unregulated market, therefore they do not have this information and consequently the indicator does not work.
a broker compatible with mt5 that offers real data flow on the demo account, without the need for a deposit, is AMP FUTURE.