Delta Cumulative Volume
- Indicators
- Angelo Capoferri
- Version: 1.1
- Activations: 5
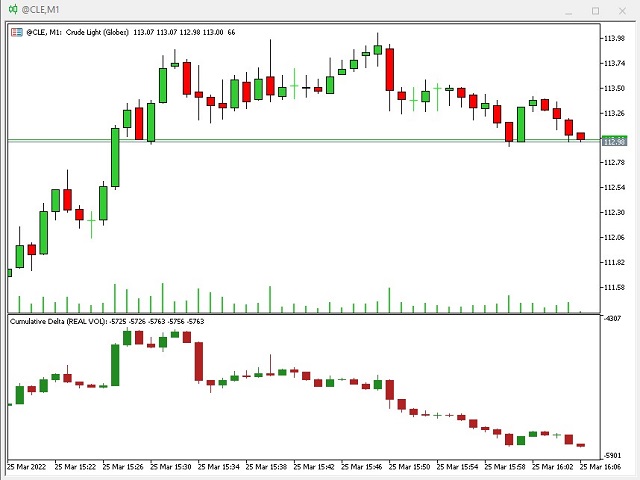
this indicator detects the difference between the contracts struck in bid and in ask (aggression) for each single candle.
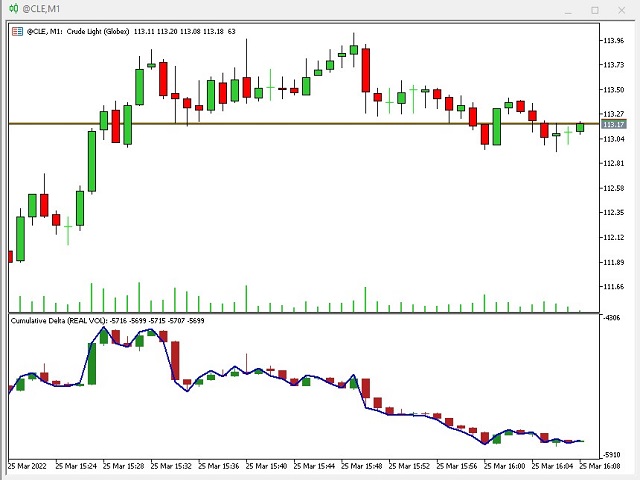
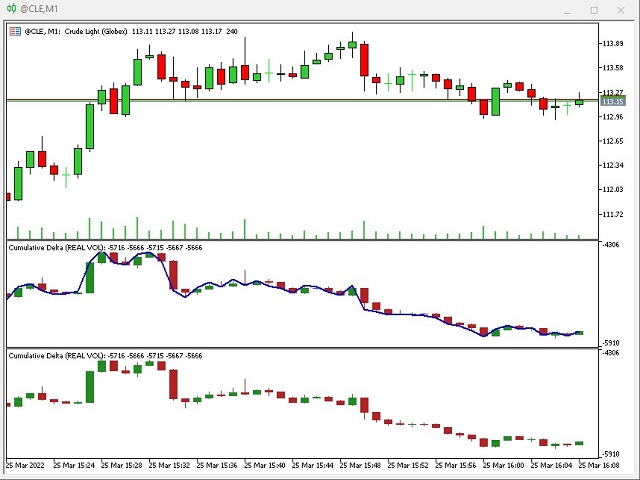
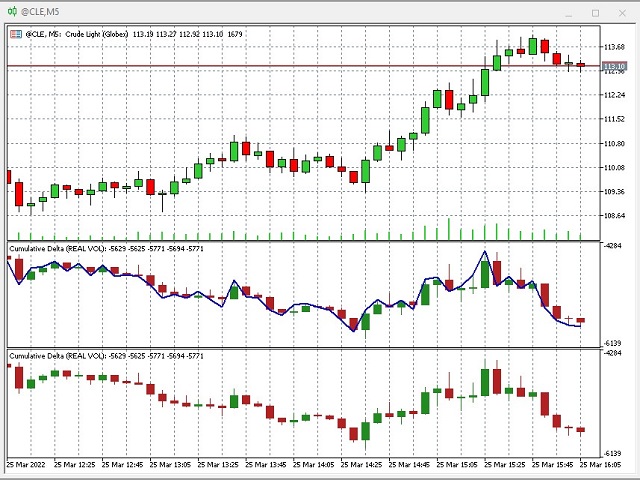
the indicator shows in the dedicated window below the price chart, candles given precisely by the difference between the contracts sold and purchased, which generate the volumetric strength of the market.
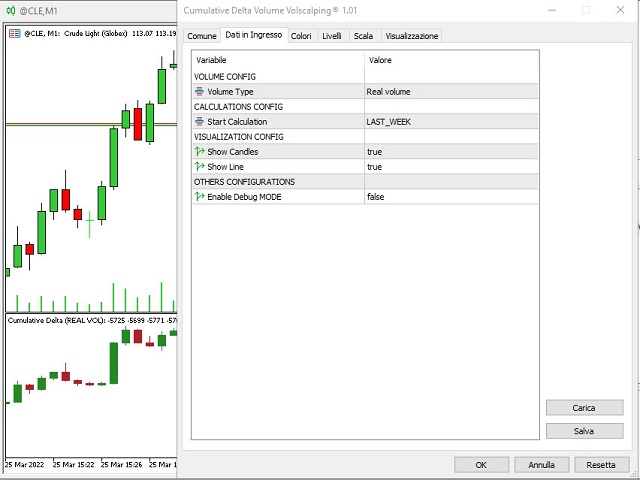
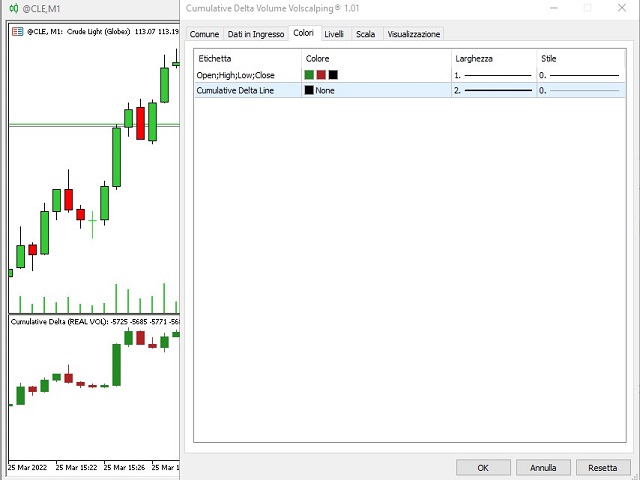
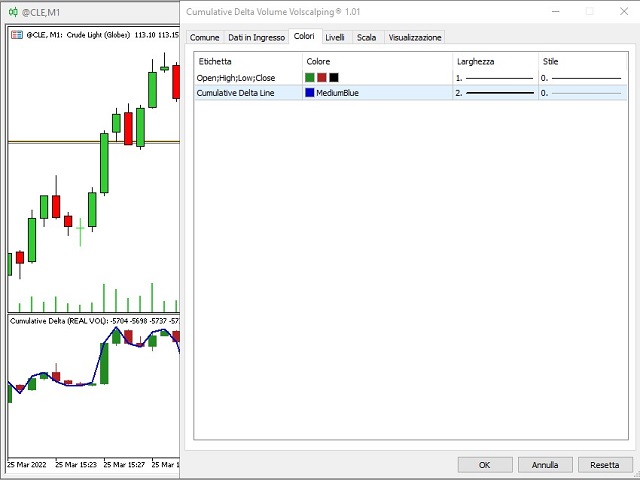
it is possible (see from the screenshots) how to select only the cumulative candlestick delta chart, or even with a trendline of the candles themselves: by selecting the second box u "NONE" no trendline will be drawn, while by selecting a color, the trendline of the volumetric candles will appear on the chart together with them.
WHAT IS THIS INDICATOR FOR? comparing the price chart with the volumetric delta chart, you can see the real strength of the market, the convergence of the two charts will determine a correct rise / fall in prices, while a divergence between prices and the volumetric delta must be a signal alert for the trader, because the price should reverse. this indicator must be used together with a trading strategy, to filter false signals, eliminating those that occur in a phase of divergence between price and volume.
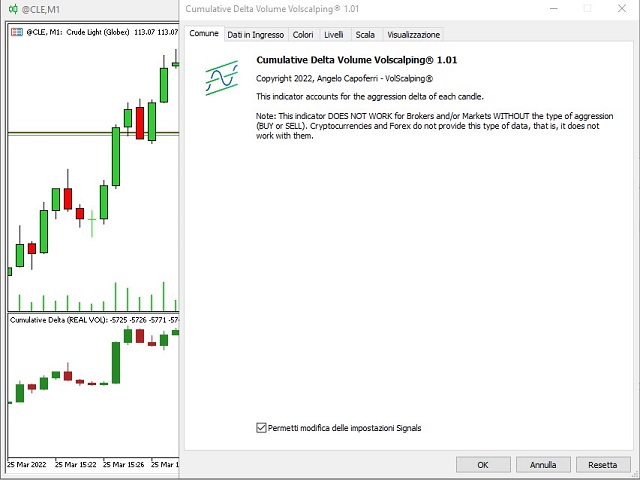
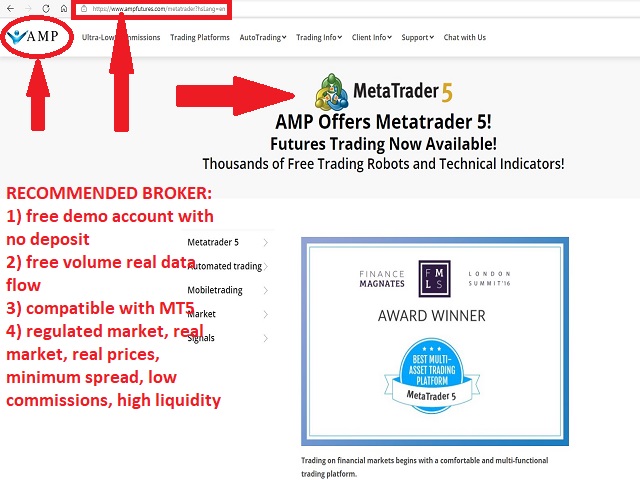
ATTENTION: the indicator works ONLY with brokers that offer the data flow of the real market, and that divide the contracts sold / bought (BID / ASK). CFD, FOREX AND CRYPTOCURRENCIES belong to the synthetic market, they do not have a real data flow and therefore the indicator DOES NOT WORK with these tools-
a broker that offers the free demo account without deposit and with real data flow, on which the indicator works, is AMP FUTURE.