• Overview
  • Reviews (4)
  • Comments (5)
  • What's new

Flosoft Supply Demand MT5

5

Among the top indicators offered here on the market in terms of value for money.

I recommend you to read the product's blog (manual) from start to end so that it is clear from the beginning what the indicator offers.

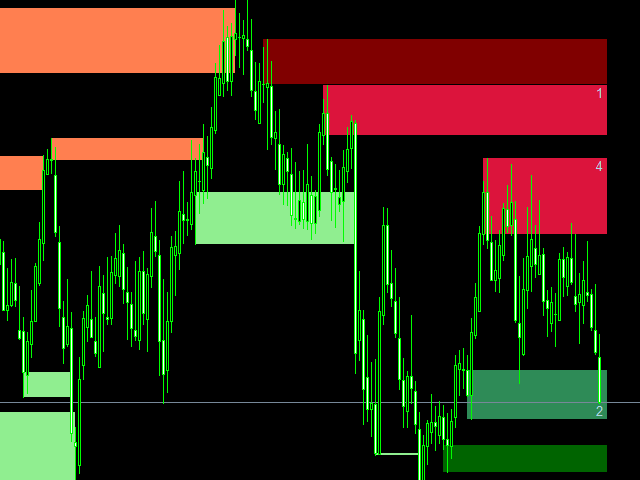
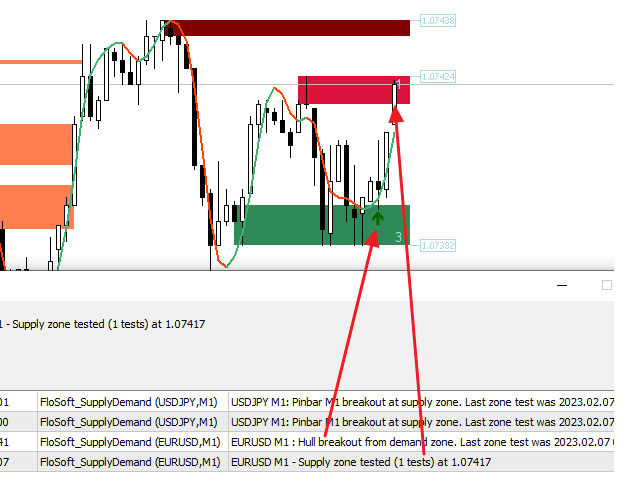
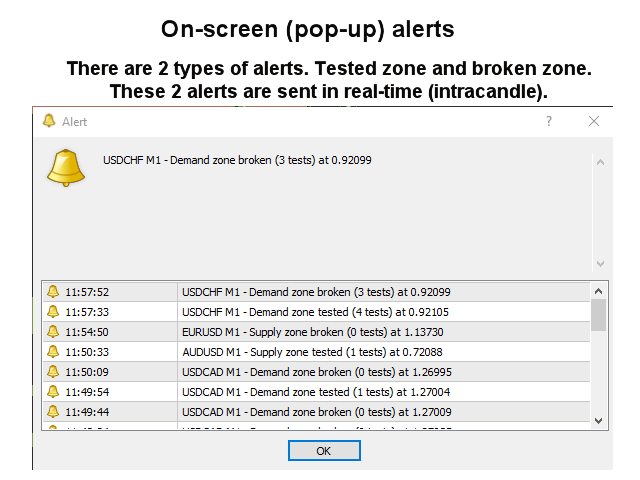
This supply and demand zone indicator draws the zones on the chart and sends alerts when the price has reached or broken a zone. It has support for one nested zones (zones on one other time frame than the current) which will also be drawn on the chart and involve alerts. It is also possible to use it to be alerted about regular double tops/bottoms instead of zones. RSI, Bollinger bands, volume, candle pattern and divergence filters can be used to filter out only the strongest setups. Combined with your own rules and techniques, this indicator will allow you to create (or enhance) your own powerful system.

Features

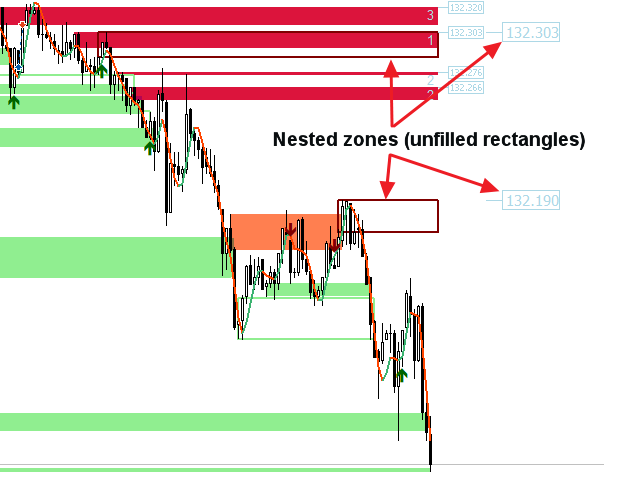
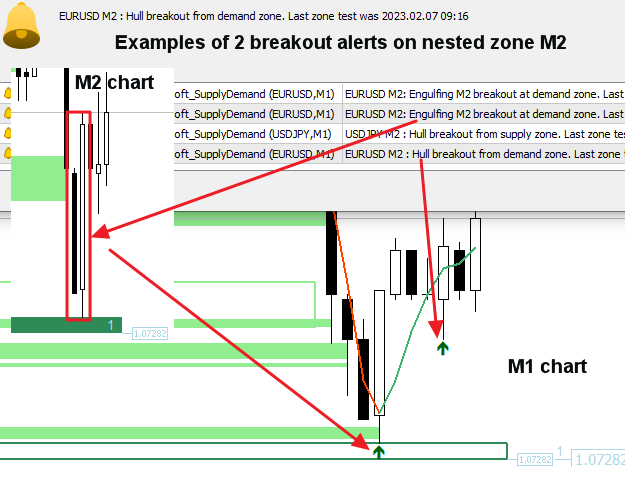
  • Can show nested zones and send alerts about them as well.
  • Reverse breakout logic from zone based on Hull moving average color change and/or 5 different candle patterns (pin bar, engulfing, tweezer, morning/evening star and three line strike). An alert will be sent and an arrow drawn on the chart.
  • The zones have 3 colors (adjustable by input). Dark color for untested zone, medium for tested zone and light for broken zone.
  • The price of the zone outer border as well as the amount of zone test are written at each zone.
  • The following divergences are supported:  MACD, OsMA, RSI, CCI, Stochastics and Awesome.
  • The indicator can write the signals to global variables which can be used by an Expert Advisor for auto trading.

Input parameters

Please find the description and explanation of the input parameters here.


Reviews 4
Poller 54
524
Poller 54 2023.12.03 02:26 
 

Very useful indicator. Easy to spot supply and demand zones in the main window. Using it for scalping. Well working, even in the 1M Timeframe. Highly recommended, for that price!

Johan Julien Aubry
909
Johan Julien Aubry 2023.02.12 11:39 
 

Powerfull indicator, very cheap and with a lot of possibilities to customise settings. Can be used for entry points or to confirm other entries. Well documented and EA compatible. Jan is really helpful and very reactive. I totally recommend this product!

cubetrader33
693
cubetrader33 2022.11.08 02:28 
 

Best demand and supply indicator, recommended 100 %. For what it does the price is too low.

Recommended products
Fractal Ichimoku
Sylvestre Setufa Djagbavi
INTRODUCTION Please, even if you already have a lot of trading knowledge, take the time to read before paying bots. Whether it's mine, or for someone else. You can't know everything. Trading is a business of probability. No matter what type of strategy, robot or analysis (technical or fundamental) you use, you can never know for sure, if your next trade will win or lose, you can never know for sure if your next month will be a gain or a loss. All you can be sure of is that, if you have done a go
Hot Zones MT5
Innovicient Limited
This indicator simplifies your entry zones by displaying the areas where you can plan your entry that potentially could give you high risk/reward ratios. Other than picking the most optimal entry points, the Hot Zone indicator can act as your typical support/resistance indicator for pullbacks for all timeframes. You can use this indicator as the only trading indicator or use it with another indicator for reentry purposes.  Besides, when using Hot Zones, the risk/reward ratio should be well abov
Moving Average Breakout
Sylvestre Setufa Djagbavi
INTRODUCTION Please, even if you already have a lot of trading knowledge, take the time to read before paying bots. Whether it's mine, or for someone else. You can't know everything. Trading is a business of probability. No matter what type of strategy, robot or analysis (technical or fundamental) you use, you can never know for sure, if your next trade will win or lose, you can never know for sure if your next month will be a gain or a loss. All you can be sure of is that, if you have done a go
Volume Trade Levels
Mahmoud Sabry Mohamed Youssef
The idea behind this indicator is very simple , First it contains 2 mechanisms to place your trades: 1- Enter the Pips you want to duplicate to price levels. 2- Automatically let the indicator specify the largest Buy / Sell Volume Candle and place duplicated levels based on the candle itself. How it works: 1- Enter the Pips you want to duplicate to price levels:    1- once the indicator is loaded you will need first to Specify the number of pips in the indicator Configuration window ,you can g
Bollinger Ichimoku
Sylvestre Setufa Djagbavi
INTRODUCTION Please, even if you already have a lot of trading knowledge, take the time to read before paying bots. Whether it's mine, or for someone else. You can't know everything. Trading is a business of probability. No matter what type of strategy, robot or analysis (technical or fundamental) you use, you can never know for sure, if your next trade will win or lose, you can never know for sure if your next month will be a gain or a loss. All you can be sure of is that, if you have done a go
MA Fibo Retracement
Sylvestre Setufa Djagbavi
INTRODUCTION Please, even if you already have a lot of trading knowledge, take the time to read before paying bots. Whether it's mine, or for someone else. You can't know everything. Trading is a business of probability. No matter what type of strategy, robot or analysis (technical or fundamental) you use, you can never know for sure, if your next trade will win or lose, you can never know for sure if your next month will be a gain or a loss. All you can be sure of is that, if you have done a go
Supply and Demand Monster
Tsog Erdene Borjigon Enkhkhudulmur
Supply and demand zones are at the heart of   supply and demand trading . These zones are areas that show  liquidity at a specific price.  The supply zone is also called the distribution zone, while the demand zone is called the accumulation zone.   Our indicator automatically draw supply and demand zones in Metatrader 5. It give opportunity to understand trading zone and avoiding risk.
Order Blocks are supply or demand zones in which big traders can find the comfort of placing large buy and sell orders and completing a big, very big transaction. Order blocks are a unique trading strategy that helps traders find a direction in the market. Usually, it allows traders to find out what financial institutions are planning to do in a particular market and better indicate the next price movement.
SAR Ichimoku retracement
Sylvestre Setufa Djagbavi
INTRODUCTION Please, even if you already have a lot of trading knowledge, take the time to read before paying bots. Whether it's mine, or for someone else. You can't know everything. Trading is a business of probability. No matter what type of strategy, robot or analysis (technical or fundamental) you use, you can never know for sure, if your next trade will win or lose, you can never know for sure if your next month will be a gain or a loss. All you can be sure of is that, if you have done a go
This multi-currency annual dashboard analyzes the nearest high and low to the current price for a chosen number of recent years. It displays how many pips away the price is from the nearest high or low. You can set a pip threshold, and the alert will notify you when the price gets close to the specified levels. In real-time, the dashboard also provides an overview of the closest high or low values for each specific year, helping you make informed trading decisions.
Marca Dagua
Erison Francisco De Sales
3 (1)
Adiciona marca d'água com nome do ativo em negociação. Pode ser ajustado definindo tamanho da fonte e coloração do texto. Testado com vários ativos do mercado B3 e Forex  Adione ao gráfico e configure de acordo com a necessidade. Caso tenha problemas sinta-se a-vontade para nos avisar e providenciaremos a correção logo que possível. ______________________________
FREE
Rsi MA Breakout
Sylvestre Setufa Djagbavi
INTRODUCTION Please, even if you already have a lot of trading knowledge, take the time to read before paying bots. Whether it's mine, or for someone else. You can't know everything. Trading is a business of probability. No matter what type of strategy, robot or analysis (technical or fundamental) you use, you can never know for sure, if your next trade will win or lose, you can never know for sure if your next month will be a gain or a loss. All you can be sure of is that, if you have done a go
Smart Drawing Assist PRO MT5. Buttons will appears next to the selected object. The buttons are straightforward and amazingly easy to use. Features are as follow: Draw zigzag . Enabling you to draw patterns, draw zigzag, and draw shapes. All you have to do is click the button and start clicking point to point and it will draw automatically. Change object color . Rectangle/Trendline/HLine/Vline/Text/Price Arrow/Arrowed Line/ and your suggestion please. Flatten trendline . make a perfect flat line
Indicator LTS for MT5 (Level + Trends + Speed) The LTS indicator was specially created for quick analysis of consolidations on the chart, which greatly facilitates decision-making when trading. LTS marks resistance and gives information about the forces affecting it, as well as the current speed and average travel. The indicator is easily customizable and can analyze any timeframe.    LTS uses a unique trend analysis algorithm based on 4 parameters from global to local.
PAM Scalper PRO FX
Jesper Christensen
4.71 (17)
PAM SCALPER (Price action momentum scalper) analyses historical price data to identify supply and demand zones where liquidity is high and enters with momentum of the institutional money flow. The EA extrapolates areas to either buy or sell from historical price action and volume data.  If you want to backtest this EA or any other scalper EA, you must use high quality tick data. The historical data your broker provides through MT5 will give inacurate test results. You can follow my guide how to
"Hunttern harmonic pattern finder" base on the dynamic zigzag with the notification and prediction mode This version of the indicator identifies 11 harmonic patterns and predicts them in real-time before they are completely formed. It offers the ability to calculate the error rate of Zigzag patterns depending on a risk threshold. It moreover sends out a notification once the pattern is complete. The supported patterns: ABCD BAT ALT BAT BUTTERFLY GARTLEY CRAB DEEP CRAB CYPHER SHARK THREE DRIV
Standard Deviation Pivot Point will enhance your trading and highlight great trade opportunities with the Support and Resistance levels that professionals use based on volatility of market. Standard Deviation Pivot trading is a simple effective method for entry and finding targets that are statistically on your side, highlighting market key levels has been used by professionals for decades and is effective on all symbols: Forex, Crypto, Stocks, Indices. Standard deviation is a measurement if vol
TimeView Pro
Jonathan San Juan
TimeView Pro – Customizable Local Time Display for MetaTrader 5 Overview TimeView Pro is a fully customizable time display indicator for MetaTrader 5. It provides an on-chart local time reference that automatically adapts to the user's system time or country time. Unlike similar indicators, TimeView Pro offers advanced customization and unique features to enhance time tracking without cluttering the chart. Key Features Snap to Candle (Default: Enabled) – The time display aligns precisely with th
Unlock the power of Fibonacci with our advanced indicator! This tool precisely plots Fibonacci levels based on the previous day's high and low, identifying the next day's key support and resistance levels. Perfect for day trading and swing trading, it has consistently generated weekly profits for me. Elevate your trading strategy and seize profitable opportunities with ease. NOTE: In the Input section make sure the draw labels are set to "True" so you can see each levels.
Volume by Price MT5
Brian Collard
3.25 (4)
Volume Profile, Footprint and Market Profile TPO (Time Price Opportunity). Volume and TPO histogram bar and line charts. Volume Footprint charts. TPO letter and block marker collapsed and split structure charts. Static, dynamic and flexible range segmentation and compositing methods with relative and absolute visualizations. Session hours filtering and segment concatenation with Market Watch and custom user specifications. Graphical layering, positioning and styling options to suit the user's a
IX Power MT5
Daniel Stein
4.86 (7)
IX Power: Unlock Market Insights for Indices, Commodities, Cryptos, and Forex Overview IX Power is a versatile tool designed to analyze the strength of indices, commodities, cryptocurrencies, and forex symbols. While FX Power offers the highest precision for forex pairs by leveraging all available currency pair data, IX Power focuses exclusively on the underlying symbol’s market data. This makes IX Power an excellent choice for non-forex markets and a reliable option for forex charts when deta
Easy Indy
Vinutthapon Bumroong
This indicator automatically draws trendlines, Fibonacci levels, support and resistance zones, and identifies BOS (Break of Structure) and CHOCH (Change of Character) patterns on the chart. Just by placing it on the graph, it handles the essential technical analysis tasks for traders, providing a streamlined, effective trading tool this tools is alway make every one easy for trading.
Fully-adjustable multi-layer Fibonacci strategies to suit any risk-appetite and trading styles| Built by a grid trader >> for grid traders.  This is MT5 version, click  here  for  Blue Onyx Pi MT4  (settings and logics are same in both versions)     Real monitoring signal   -->  (Coming soon) Intro BlueOnyx Pi EA   ('Onyx') is a next-gen   multi-currency    multi-timeframe  EA base on   multi-layer / cross-timeframe Fibonacci   indicator. There are options for both grid & no-grid trading to s
Rsi MA Pullback
Sylvestre Setufa Djagbavi
INTRODUCTION Please, even if you already have a lot of trading knowledge, take the time to read before paying bots. Whether it's mine, or for someone else. You can't know everything. Trading is a business of probability. No matter what type of strategy, robot or analysis (technical or fundamental) you use, you can never know for sure, if your next trade will win or lose, you can never know for sure if your next month will be a gain or a loss. All you can be sure of is that, if you have done a go
The default input values are already optimized for EURUSD at time frame M1, spread at 14 and hedged account mode with leverage 1:100 and initial deposit of US$ 10,000, if you don't have this balance, I suggest you to use a CENT account. Always use the strategy tester optimization to set the best values for your assets, time frame, spread and account mode. It is very important and strongly recommended for successful trading. Optimize the input values as your needs.The EA's Strategy The Strategy T
Ultimate Supply Demand MT5
Ramon Sobrevals Arce
5 (4)
After working during many months, with the help of Neural Networks, we have perfected the ultimate tool you are going to need for identifying key price levels (Supports and Resistances) and Supply and Demand zones. Perfectly suitable to trigger your trades, set up your future actions, decide your Take Profit and Stop Loss levels, and confirm the market direction. Price will always move between those levels, bouncing or breaking; from one zone to another, all the remaining movements are just mark
Expert GOLD Master
Jean Christophe Paput
3 (2)
Expert GOLD Master   is a fully automated & customizable EA. The EA's objective is to provide steady incomes with a high level of safeness  .  THE EA IS CHALLENGES PROPFIRMS COMPATIBLE . ++++++++ The algorythm is based on an auto-adaptive system combined with  the Moving Average indicator  that  is constantly controlling : - The best moment to open a trade - The distance between orders - The lot size of orders - The level of security  ++++++++ Example of profits on 1 month, 2 months,
Rsi MA Adx
Sylvestre Setufa Djagbavi
INTRODUCTION Please, even if you already have a lot of trading knowledge, take the time to read before paying bots. Whether it's mine, or for someone else. You can't know everything. Trading is a business of probability. No matter what type of strategy, robot or analysis (technical or fundamental) you use, you can never know for sure, if your next trade will win or lose, you can never know for sure if your next month will be a gain or a loss. All you can be sure of is that, if you have done a go
Horizontal Level indicator - reflects, using a histogram, the horizontal volumes of transactions at a certain price without reference to time. At the same time, the histogram appears directly in the terminal window, and each column of the volume is easily correlated with the quote value of the currency pair. The volume of transactions is of great importance in exchange trading, usually an increase in the number of concluded contracts confirms the trend, and their reduction indicates an imminent
Quarterly Cycles
Barend Paul Stander
5 (1)
Quarterly Cycles Quarterly Cycles is based on the Quarterly Theory developed by Daye (  traderdaye on X ). This is an aid to the user to find Cycles and it is NOT automatic detected, user can select AMDX or XAMD  in each Cycle and it will be visually drawn on the chart.  Quarterly Cycles:   Yearly, Monthly, Weekly, Daily, 6 Hour (90 minutes) –  Yearly Cycle : The year is divided in four sections of three months each Q1 - January, February, March Q2 - April, May, June Q3 - July, August, Septemb
Buyers of this product also purchase
Trend Screener Pro MT5
STE S.S.COMPANY
4.85 (79)
Unlock the Power of Trends Trading with the Trend Screener Indicator: Your Ultimate Trend Trading Solution powered by Fuzzy Logic and Multi-Currencies System! Elevate your trading game with the Trend Screener, the revolutionary trend indicator designed to transform your Metatrader into a powerful Trend Analyzer. This comprehensive tool leverages fuzzy logic and integrates over 13 premium features and three trading strategies, offering unmatched precision and versatility. LIMITED TIME OFFER : Tre
MONEYTRON – ТВОЙ ЛИЧНЫЙ СИГНАЛ НА УСПЕХ! XAUUSD | AUDUSD | USDJPY | BTCUSD Поддержка таймфреймов: M5, M15, M30, H1 Почему трейдеры выбирают Moneytron? 82% успешных сделок — это не просто цифры, это результат продуманной логики, точного алгоритма и настоящей силы анализа. Автоматические сигналы на вход — не нужно гадать: когда покупать, когда продавать. 3 уровня Take Profit — ты сам выбираешь свой уровень прибыли: безопасный, уверенный или максимум. Четкий Stop Loss — контролируешь риск
Algo Pumping
Ihor Otkydach
5 (7)
PUMPING STATION – Your Personal All-inclusive strategy Introducing PUMPING STATION — a revolutionary Forex indicator that will transform your trading into an exciting and effective activity! This indicator is not just an assistant but a full-fledged trading system with powerful algorithms that will help you start trading more stable! When you purchase this product, you also get FOR FREE: Exclusive Set Files: For automatic setup and maximum performance. Step-by-step video manual: Learn how to tr
Golden Trend Indicator MT5
Noha Mohamed Fathy Younes Badr
4.89 (18)
Golden Trend indicator  is The best indicator for predicting trend movement this indicator never lags and never repaints and never back paints    and give  arrow buy and sell    before the candle appear  and it will help you and  will make your trading decisions clearer its work on all currencies and  gold and crypto and all time frame This unique  indicator uses very secret algorithms to catch the  trends, so you can trade using this indicator and see the trend clear on charts  manual guide and
FX Volume MT5
Daniel Stein
4.82 (17)
FX Volume: Experience Genuine Market Sentiment from a Broker’s Perspective Quick Overview Looking to elevate your trading approach? FX Volume provides real-time insights into how retail traders and brokers are positioned—long before delayed reports like the COT. Whether you’re aiming for consistent gains or simply want a deeper edge in the markets, FX Volume helps you spot major imbalances, confirm breakouts, and refine your risk management. Get started now and see how genuine volume data can
Support And Resistance Screener Breakthrough unique Solution With All Important levels analyzer and Markets Structures Feature Built Inside One Tool ! Our indicator has been developed by traders for traders and with one Indicator you will find all Imporant market levels with one click. LIMITED TIME OFFER : Support and Resistance Screener Indicator is available for only 50 $ and lifetime. ( Original price 125$ ) (offer extended) The available tools ( Features ) in our Indicator are :  1. HH-LL S
FX Power MT5 NG
Daniel Stein
5 (14)
FX Power: Analyze Currency Strength for Smarter Trading Decisions Overview FX Power is your go-to tool for understanding the real strength of currencies and Gold in any market condition. By identifying strong currencies to buy and weak ones to sell, FX Power simplifies trading decisions and uncovers high-probability opportunities. Whether you’re looking to follow trends or anticipate reversals using extreme delta values, this tool adapts seamlessly to your trading style. Don’t just trade—trade
Grabber System MT5
Ihor Otkydach
5 (5)
Let me introduce you to an excellent technical indicator – Grabber, which works as a ready-to-use "All-Inclusive" trading strategy. Within a single code, it integrates powerful tools for technical market analysis, trading signals (arrows), alert functions, and push notifications. Every buyer of this indicator also receives the following for free: Grabber Utility for automatic management of open orders Step-by-step video guide: how to install, configure, and trade with the indicator Custom set fi
Quantum TrendPulse
Bogdan Ion Puscasu
5 (13)
Introducing Quantum TrendPulse , the ultimate trading tool that combines the power of SuperTrend , RSI , and Stochastic into one comprehensive indicator to maximize your trading potential. Designed for traders who seek precision and efficiency, this indicator helps you identify market trends, momentum shifts, and optimal entry and exit points with confidence. Key Features: SuperTrend Integration: Easily follow the prevailing market trend and ride the wave of profitability. RSI Precision: Detect
TPSproTREND PrO MT5
Roman Podpora
4.72 (18)
VERSION MT4        —        ИНСТРУКЦИЯ RUS           —        INSTRUCTIONS  ENG Main functions: Accurate entry signals WITHOUT REPAINTING! Once a signal appears, it remains valid! This is a significant distinction from repainting indicators that might provide a signal and then alter it, potentially leading to deposit losses. Now, you can enter the market with higher probability and precision. There's also a function to color candles after an arrow appears until the target (take profit) is reac
Gold Stuff mt5
Vasiliy Strukov
4.93 (178)
Gold Stuff mt5 is a trend indicator designed specifically for gold and can also be used on any financial instrument. The indicator does not redraw and does not lag. Recommended time frame H1. Contact me immediately after the purchase to get   personal bonus!  You can get a free copy of our Strong Support and Trend Scanner indicator, please pm. me! Settings  and manual   here  Please note that I do not sell my EA's or special sets on telegram, it is only available on Mql5 and my set files are on
FX Levels MT5
Daniel Stein
5 (4)
FX Levels: Exceptionally Accurate Support & Resistance for All Markets Quick Overview Looking for a reliable way to pinpoint support and resistance levels across any market—currencies, indices, stocks, or commodities? FX Levels merges our traditional “Lighthouse” method with a forward-thinking dynamic approach, offering near-universal accuracy. By drawing from real-world broker experience and automated daily plus real-time updates, FX Levels helps you identify reversal points, set profit targe
Matrix Arrow Indicator MT5
Juvenille Emperor Limited
5 (13)
Matrix Arrow Indicator MT5  is a unique 10 in 1 trend following   100% non-repainting  multi-timeframe indicator that can be used on all symbols/instruments:   forex,   commodities,   cryptocurrencies,   indices,   stocks .  Matrix Arrow Indicator MT5  will determine the current trend at its early stages, gathering information and data from up to 10 standard indicators, which are: Average Directional Movement Index (ADX) Commodity Channel Index (CCI) Classic Heiken Ashi candles Moving Average
TPSpro RFI Levels MT5
Roman Podpora
4.55 (20)
Reversal zones / Peak volumes / Active zones of a major player =  TS TPSPROSYSTEM INSTRUCTIONS RUS  /  INSTRUCTIONS   ENG          /       Version MT4 Every buyer of this indicator additionally receives FREE: 6 months of access to trading signals from the RFI SIGNALS service - ready-made entry points according to the TPSproSYSTEM algorithm. Training materials with regular updates - immerse yourself in strategy and grow your professional level. 24/5 support on weekdays and access to a closed tra
Trade smarter, not harder: Empower your trading with Harmonacci Patterns This is arguably the most complete harmonic price formation auto-recognition indicator you can find for the MetaTrader Platform. It detects 19 different patterns, takes fibonacci projections as seriously as you do, displays the Potential Reversal Zone (PRZ) and finds suitable stop-loss and take-profit levels. [ Installation Guide | Update Guide | Troubleshooting | FAQ | All Products ] It detects 19 different harmonic pri
MTF Supply Demand Zones MT5
Georgios Kalomoiropoulos
5 (1)
Next Generation Of Automated Supply And Demand Zones. New and Innovative Algorithm that Works At Any Chart. All Zones Are Being Created Dynamically According To Price Action Of The Market. AMAZING OFFER --> Activations from 5 to 20 for "MTF Supply Demand Zones" and "Automated Trendlines" TWO TYPES OF ALERTS -->  1) WHEN PRICE HITS A ZONE    2)WHEN A NEW ZONE IS FORMED  If you get the MTF Supply Demand Zones you can join the " Trade Like Me " Video Series. It contains 14 Live Sessions where 
The Precision Index Oscillator (Pi-Osc) for MT5 by Roger Medcalf of Precision Trading Systems First of all, if you have any questions please contact me via my website which you can find by searching the above title. Version 2 has been carefully recoded to be super fast to load up on your chart and some other technical improvements have been incorporated to enhance experience. Pi-Osc was created to provide accurate trade timing signals designed to find   extreme     exhaustion points, the points
The   Time_Price_SQ9_Degree   indicator is based on the 9 Gann square. Using this indicator, you can identify strong time and price zones. The indicator displays the levels as a degree value. The degrees can be set in the settings. After launching, the MENU button appears. If it is highlighted, it can be moved to any point on the graph, and after double-clicking on it, it stops being highlighted and menu buttons appear. To hide the menu, just double-click on the button, it will become highlight
FX Dynamic: Track Volatility and Trends with Customized ATR Analysis Overview FX Dynamic is a powerful tool that leverages Average True Range (ATR) calculations to give traders unparalleled insights into daily and intraday volatility. By setting up clear volatility thresholds—such as 80%, 100%, and 130%—you can quickly identify potential profit opportunities or warnings when markets exceed typical ranges. FX Dynamic adapts to your broker’s time zone, helps you maintain a consistent measure of
PZ Mean Reversion MT5
PZ TRADING SLU
3 (2)
Outperform traditional strategies: effective mean reversion for savvy traders Unique indicator that implements a professional and quantitative approach to mean reversion trading. It capitalizes on the fact that the price diverts and returns to the mean in a predictable and measurable fashion, which allows for clear entry and exit rules that vastly outperform non-quantitative trading strategies. [ Installation Guide | Update Guide | Troubleshooting | FAQ | All Products ] Clear trading signals Am
PZ Support Resistance MT5
PZ TRADING SLU
4.17 (6)
Unlock key market insights with automated support and resistance lines Tired of plotting support and resistance lines? This is a multi-timeframe indicator that detects and plots supports and resistance lines in the chart with the same precision as a human eye would. As price levels are tested over time and its importance increases, the lines become thicker and darker, making price leves easy to glance and evaluate. [ Installation Guide | Update Guide | Troubleshooting | FAQ | All Products ] Boos
Legend mt5
Vladyslava Shaviernieva
This is an indicator that includes the best basic forex indicators , without redrawing. Based on this data, a sell or buy signal is generated. It does not disappear anywhere after the signal, which gives us the opportunity to see the results on the history. It can be used on any currency pair, crypto, metals, stocks It is best used on an hourly chart, but other periods are also acceptable. The best results for the period H1,H4,daily If customers have any questions, I will answer them and af
DESCRIPTION ICSM (Impulse-Correction SCOB Mapper) is the indicator that analyzes the price movement and identifies valid impulses, corrections and SCOBs (Single Canndle Ordere Block). It is a powerful tool that can be used with any type of technical analysis because it's flexible, informative, easy to use and it does substantially improve trader's awareness of the most liquid zones of interest. SETTINGS General | Visuals Colour theme — defines the colour theme of the ICSM. SCOB | Visuals Show
ATrend
Zaha Feiz
4.77 (13)
ATREND: How It Works and How to Use It How It Works The " ATREND " indicator for the MT5 platform is designed to provide traders with robust buy and sell signals by utilizing a combination of technical analysis methodologies. This indicator primarily leverages the Average True Range (ATR) for volatility measurement, alongside trend detection algorithms to identify potential market movements. Leave a massage after purchase and receive a special bonus gift. Key Features: ⦁ Dynamic Trend Detect
Advanced Supply Demand MT5
Bernhard Schweigert
4.5 (14)
Best Solution for any Newbie or Expert Trader! This indicator is a unique, high quality and affordable trading tool because we have incorporated a number of proprietary features and a new formula. With this update, you will be able to show double timeframe zones. You will not only be able to show a higher TF but to show both, the chart TF, PLUS the higher TF: SHOWING NESTED ZONES. All Supply Demand traders will love it. :) Important Information Revealed Maximize the potential of Advanced Supply
This dashboard shows the latest available   harmonic patterns   for the selected symbols, so you will save time and be more efficient /   MT4 version . Free Indicator:   Basic Harmonic Pattern Comparison of "Basic Harmonic Pattern" vs. "Basic Harmonic Patterns Dashboard" Indicators Feature Basic Harmonic Pattern Basic Harmonic Patterns Dashboard Functionality Detects and displays harmonic patterns on a single chart Searches multiple symbols and timeframes for harmonic patterns, displays res
KT Candlestick Patterns MT5
KEENBASE SOFTWARE SOLUTIONS
KT Candlestick Patterns finds and marks the 24 most dependable Japanese candlestick patterns in real-time. Japanese traders have been using candlestick patterns to predict the price direction since the 18th century. It's true that not every candlestick pattern can be equally trusted to predict the price direction reliably. However, when combined with other technical analysis methods like Support and Resistance, they provide an exact and unfolding market situation. This indicator includes many
FxaccurateLS
Shiv Raj Kumawat
WHY IS OUR FXACCCURATE LS MT5 THE PROFITABLE ? PROTECT YOUR CAPITAL WITH RISK MANAGEMENT Gives entry, stop and target levels from time to time. It finds Trading opportunities by analyzing what the price is doing during established trends. POWERFUL INDICATOR FOR A RELIABLE STRATEGIES We have made these indicators with a lot of years of hard work. It is made at a very advanced level. Established trends provide dozens of trading opportunities, but most trend indicators completely ignore them! The
Blahtech Supply Demand MT5
Blahtech Limited
4.54 (13)
Was: $299  Now: $149  Supply Demand uses previous price action to identify potential imbalances between buyers and sellers. The key is to identify the better odds zones, not just the untouched ones. Blahtech Supply Demand indicator delivers functionality previously unavailable on any trading platform. This 4-in-1 indicator not only highlights the higher probability zones using a multi-criteria strength engine, but also combines it with multi-timeframe trend analysis, previously confirmed swings
TPA True Price Action indicator reveals the true price action of the market makers through 100% non-repainting signals strictly at the close of a candle! TPA shows entries and re-entries, every time the bulls are definitely stronger than the bears and vice versa. Not to confuse with red/green candles. The shift of power gets confirmed at the earliest stage and is ONE exit strategy of several. There are available now two free parts of the TPA User Guide for our customers. The first "The Basics"
More from author
I recommend you to read the   product's blog  (manual) from start to end so that it is clear from the beginning what the indicactor offers. This multi time frame and multi symbol divergence dashboard indicator sends an alert when one or two different divergences have been identified. It can be used with all time frames from M1 to MN. Maximum 9 time frames can be shown in the dashboard at the same time. It is possible to enable moving average, RSI or Bollinger bands trend filter to filter out on
I recommend you to read the  product's blog  (manual) from start to end so that it is clear from the beginning what the EA offers. This Expert Advisor identifies when a divergence occurs between price and an oscillator/indicator. It identifies both regular/classical (trend reversal) and hidden (trend continuation) divergences. It has supply/demand zone, RSI, bollinger, stochastics, moving average (regular MA and Hull MA), ADX and volume filter options which makes it possible to filter out only
The indicator identifies when a divergence occurs between price and an indicator or oscillator. It identifies both regular and hidden divergences. Combined with your own rules and techniques, this indicator will allow you to create (or enhance) your own powerful system. Features Can detect divergences for the following oscillators/indicators:   MACD, OsMA, Stochastics, RSI, CCI, RVI, Awesome, ADX, ATR, OBV, Composite index, MFI and Momentum. Only one oscillator/indicator can be selected. Draws
FREE
This indicator draws supply and demand zones on the chart. Combined with your own rules and techniques, this indicator will allow you to create (or enhance) your own powerful system. Please also check out the paid version which offers much more. My recommendation is to look for trading opportunities where the first zone test occurs after at least 25 bars. Features The zones have 3 colors (adjustable by input). Dark color for untested zone, medium for tested zone and light for broken zone . The p
FREE
Please if possible consider buying the MT5 version   which at the moment offers more functionaIity . I also recommend you to read the product's blog  (manual) from start to end so that it is clear from the beginning what the EA offers. This Expert advisor's (EA) main strategy is to place trades when 3 moving averages (MA) are in consecutive alignment and at a certain distance from each other (it can be used for instance for a not very well known strategy used by some institutional traders, whic
I recommend you to read the   product's blog  (manual) from start to end so that it is clear from the beginning what the indicactor offers. This multi time frame and multi symbol indicator identifies double or triple top/bottom formations or a following neckline breakout (confirmed top/bottom). It offers filters for RSI overbought/oversold, candle patterns (pin bar, engulfing, tweezer, morning/evening star, three line strike) and divergences (MACD, OsMA, Awesome (AO), RSI, CCI, Stochastic) whic
I recommend you to read the   product's blog  (manual) from start to end so that it is clear from the beginning what the indicactor offers. This multi time frame and multi symbol indicator can identify the following 5 crosses: when a fast moving average crosses a slow moving average line. when price has reached a single moving average (closed above/below or just bounced). when a triple moving average formation has appeared (all 3 MA:s in consecutive alignment) when the MACD main line crosses th
This indicator draws supply and demand zones on the chart. Combined with your own rules and techniques, this indicator will allow you to create (or enhance) your own powerful system. Please also check out the   paid version   which offers much more. My recommendation is to look for trading opportunities where the first zone test occurs after at least 25 bars. Features The zones have 3 colors (adjustable by input). Dark color for untested zone, medium for tested zone   and light for broken zone .
FREE
This indicator can send alerts when a Heiken Ashi Smoothed color change occurs. Combined with your own rules and techniques, this indicator will allow you to create (or enhance) your own powerful system. Features Can send all types of alerts. Option to delay the alert one or more bars in order to confirm the color (trend) change. Input parameters Candle shift for alert: Default is 1. Setting it to 0 will alert you on color change on the current candle. This should be regarded as a pending (uncon
FREE
This indicator recognizes a special type of Inside Bar formation which is formed by a big Master candle followed by 4 smaller candles (please see the strategy explanation below). Features Plots buy/sell stop lines on the chart as well as well as take profit and stop loss levels. The TP/SL levels are based on the Average True Range (ATR) indicator. Object colors are changeable. Sends you a real-time alert when a Master candle formation is identified - sound / popup / email / push notification. On
The indicator identifies when a divergence occurs between price and an indicator or oscillator. It identifies bullish and bearish hidden or regular (classical) divergences. Combined with your own rules and techniques, this indicator will allow you to create (or enhance) your own powerful system. Features Can detect divergences for the following indicators/oscillators: MACD, OsMA (Moving average of Oscillator), Stochastics, RSI, CCI, RVI, Awesome (AO), ADX, ATR, OBV, MFI, Momentum and   Composit
FREE
This indicator can send alerts when a Heiken Ashi Smoothed color change occurs. Combined with your own rules and techniques, this indicator will allow you to create (or enhance) your own powerful system. Features Can send all types of alerts. Option to delay the alert one bar in order to confirm the color (trend) change. Input parameters Wait for candle close: 'true' or 'false'. Setting it to 'true' will delay the alert to the opening of the bar following the bar where the color change occurred.
FREE
I  recommend you to read the   product's blog  (manual) from start to end so that it is clear from the beginning what the indicator offers. This multi time frame and multi symbol indicator scans for Pin bars, Morning/evening stars, Engulfings, Tweezers, Three Line Strikes, Inside bars and Pennants and Triangles.  The indicator can also be used in single chart mode. Please read more about this option in the product's   blog . Combined with your own rules and techniques, this indicator will allow
I recommend you to read the   product's blog  (manual) from start to end so that   it is clear from the beginning what the indicator offers. This multi time frame and multi symbol indicator identifies double top/bottom, head & shoulder, pennant/triangle and flag patterns. It is also possible to setup alerts only when a neckline/triangle/flagpole breakout has occured (neckline breakout = confirmed signal for top/bottoms and head & shoulders). The indicator can also be used in single chart mode.
Divergence dashboard
Jan Flodin
4.64 (11)
I recommend you to read the   product's blog  (manual) from start to end so that it is clear from the beginning what the indicactor offers. This multi time frame and multi symbol divergence dashboard indicator sends an alert when one or two different divergences have been identified. It can be used with all time frames from M1 to MN. It is possible to enable moving average or RSI trend filter to filter out only the strongest setups. It should be combined with your own confirmation rules, techni
I recommend you to read the   product's blog  (manual) from start to end so that   it is clear from the beginning what the indicator offers. The indicator identifies when a divergence occurs between price and an oscillator/indicator. It identifies both regular and hidden divergences. It has a RSI, Bollinger Bands and ATR filter options which makes it possible to filter out only the strongest setups. The indicator also offers options to wait for an Engulfing formation, Donchian channel breakout,
I recommend you to read the   product's blog  (manual) from start to end so that it is clear from the beginning what the indicactor offers. This multi time frame and multi symbol indicator identifies double or triple top/bottom formations or a following neckline breakout (confirmed top/bottom). It offers RSI, pin bar, engulfing, tweezer, morning/evening star filters as well divergence filter options which makes it possible to filter out only the strongest setups. The indicator can also be used
This multi time frame and multi symbol indicator scans for pin bars. Combined with your own rules and techniques, this indicator will allow you to create (or enhance) your own powerful system. Features Can monitor all symbols visible in your Market Watch window at the same time. Apply the indicator to just one chart and instantly monitor the entire market. Can monitors every time frame, from M1 to MN, and sends you a real-time alert when a pin bar is identified. All Metatrader native alert types
This multi symbol dashboard indicator can send an alert when a strong trend has been identified. It can do so by building up the dashboard using the following indicators/oscillators (hereafter only mentioned as incdicators): RSI, Stochastics, ADX, CCI, MACD, WPR (Williams Percent Range, also called as Williams %R), ROC (Price Rate of Change) and Ultimate oscillator. It can be used with all time frames from M1 to MN (it can only show 1 time frame at a time). It gives you perspectives on momentum,
I recommend you to read the product's blog  (manual) from start to end so that it is clear from the beginning what the EA offers. This Expert advisor's (EA) main strategy is to place trades when 3 moving averages (MA) are in consecutive alignment and at a certain distance from each other (it can be used for instance for a not very well known strategy used by some institutional traders, which involves the MAs 10, 20 and 30 on the D1 time frame). The EA works best on H1 and larger time frames. Th
This cost averaging Expert advisor (EA) places additional trades in the same direction as the original (manually opened) order when the price goes against you. It can be used as a grid system or as pure martingale system (exponential increasing of lot size) or smoothed martingale (for instance linear increasing of the lot size). Due to the risk involved, this EA is more suitable for intermediate to advanced traders who are well aware of how to handle risk management and trading an already profit
This multi symbol indicator has been designed to automatically identify when price reaches major psychological levels. Also known as round numbers, whole numbers or key levels. As a bonus it can also scan for pivot point level on one selected time frame. Combined with your own rules and techniques, this indicator will allow you to create (or enhance) your own powerful system. Features Can write the signals to a file which can be used by an Expert Advisor for auto trading. Can monitor all symbols
This multi time frame and multi symbol indicator identifies high-probability breakout patterns. It does this by identifying strong, symmetrical pennants and triangles. This pattern DOES NOT appear very often on higher time frames. But when it does, it is a very high-probability setup. The indicator also includes an Inside bars scanner. It can for example be used to detect a special type of Inside bars formation which is formed by a Master candle (MC) followed by 4 inside candles (please see the
Features This is an indicator that recognizes a special type of Inside Bar formation which is formed by a Master candle followed by 4 smaller candles (please see the strategy explanation below). Plots buy/sell stop lines on the chart as well as well as take profit and stop loss levels. The TP/SL levels are based on the Average True Range (ATR) indicator. Object colors are changeable. Sends you a real-time alert when a Master candle formation is identified - sound / pop-up / email / push notifica
This multi time frame and multi symbol indicator scans for pin bars. Combined with your own rules and techniques, this indicator will allow you to create (or enhance) your own powerful system. Features Can monitor all symbols visible in your Market Watch window at the same time. Apply the indicator to just one chart and instantly monitor the entire market. Can monitors every time frame, from M1 to MN, and sends you a real-time alert when a pin bar is identified. All Metatrader native alert types
I  recommend you to read the   product's blog  (manual) from start to end so that it is clear from the beginning what the indicator offers. This multi time frame and multi symbol indicator scans for engulfing and tweezer formations. The indicator can also be used in single chart mode. Combined with your own rules and techniques, this indicator will allow you to create (or enhance) your own powerful system. Features Can monitor all symbols visible in your Market Watch window at the same time. Ap
This multi time frame and multi symbol indicator scans for Pin bars, Morning/Evening stars, Engulfings, Tweezers, Three line strikes, Inside bars and Pennants and Triangles. The indicator can also be used in single chart mode. Please read more about this option in the product's blog . Combined with your own rules and techniques, this indicator will allow you to create (or enhance) your own powerful system. Features Can monitor all symbols visible in your Market Watch window at the same time. App
I  recommend you to read the   product's blog  (manual) from start to end so that it is clear from the beginning what the indicator offers. This multi symbol and multi time frame indicator scans for the following candlestick patterns (please see screenshot for explanation of the patterns): Three white soldiers (reversal>continuation pattern) Three black crows (reversal>continuation pattern) Bullish and bearish Three line strike (reversal pattern) The patterns do not appear very often on higher
I recommend you to read the   product's blog  (manual) from start to end so that it is clear from the beginning what the indicactor offers. This multi time frame and multi symbol indicator can identify the following 5 crosses: when a fast moving average crosses a slow moving average line. when price has reached a single moving average (closed above/below or just bounced). when a triple moving average formation has appeared (all 3 MA:s in consecutive alignment). when the MACD main line crosses t
I recommend you to read the   product's blog  (manual) from start to end so that it is clear from the beginning what the indicactor offers. This indicator for Metatrader 4 identifies when a divergence occurs between price and an oscillator/indicator. It identifies both bullish and bearish divergences. It has a RSI filter option which makes it possible to filter out only the strongest setups. The indicator also offers options to wait for an Engulfing formation, Donchian channel breakout or for p
Filter:
ZERO9898.Tom KC Wang
1982
ZERO9898.Tom KC Wang 2024.01.25 12:24 
 

User didn't leave any comment to the rating

Poller 54
524
Poller 54 2023.12.03 02:26 
 

Very useful indicator. Easy to spot supply and demand zones in the main window. Using it for scalping. Well working, even in the 1M Timeframe. Highly recommended, for that price!

Johan Julien Aubry
909
Johan Julien Aubry 2023.02.12 11:39 
 

Powerfull indicator, very cheap and with a lot of possibilities to customise settings. Can be used for entry points or to confirm other entries. Well documented and EA compatible. Jan is really helpful and very reactive. I totally recommend this product!

cubetrader33
693
cubetrader33 2022.11.08 02:28 
 

Best demand and supply indicator, recommended 100 %. For what it does the price is too low.

Reply to review
Version 1.7 2024.01.22
*** IMPORTANT - Please always make a backup of the existing indicator (the .ex5 file) before you make the update ***

This is not a mandatory update. Please only update if you are experiencing problems with the indicator after the new Metatrader build 4150
Version 1.6 2023.04.21
*** IMPORTANT - Please always make a backup of the existing indicator (the .ex5 file) before you make the update ***

Change log:
- various bug fixes in the divergence detection mechanism
- added Three line strike to the list of candle patterns
- fixed an issue with the morning/evening star candle patter scanning
- added Bollinger bands filter as an alternative to RSI
- added a new type of alert when price is close to (approaching) a zone. ATR or points can be used as offset value
Version 1.5 2023.04.06
*** IMPORTANT - please always make a backup of the existing indicator (the .ex5 file) before you make an update ***

Change log:
- fixed an issue with the drawing of trend lines when supply/demand was disabled (regular top/bottoms only)
Version 1.4 2023.02.11
*** IMPORTANT - please always make a backup of the existing indicator (the .ex5 file) before you make an update ***

Change log:
- bug fixe
Version 1.3 2023.02.07
*** IMPORTANT - please always make a backup of the existing indicator (the .ex5 file) before you make an update ***

Change log:
- various bug fixes
Version 1.2 2023.02.06
*** IMPORTANT - please always make a backup of the existing indicator (the .ex5 file) before you make an update ***

Change log:
- added support for one nested zone (zone on other time frame than the current)
- added reverse breakout logic from zone based on Hull moving average color change and/or 4 different candle patterns. An alert will be sent and an arrow drawn on the chart
- removed the non functional option to use the RSI filter on the second extremum (at zone test)
- price raised from $30 to $49
Version 1.1 2022.02.23
- bug fix