• Overview
  • Reviews (1)
  • Comments (7)

UPD1 D Levels

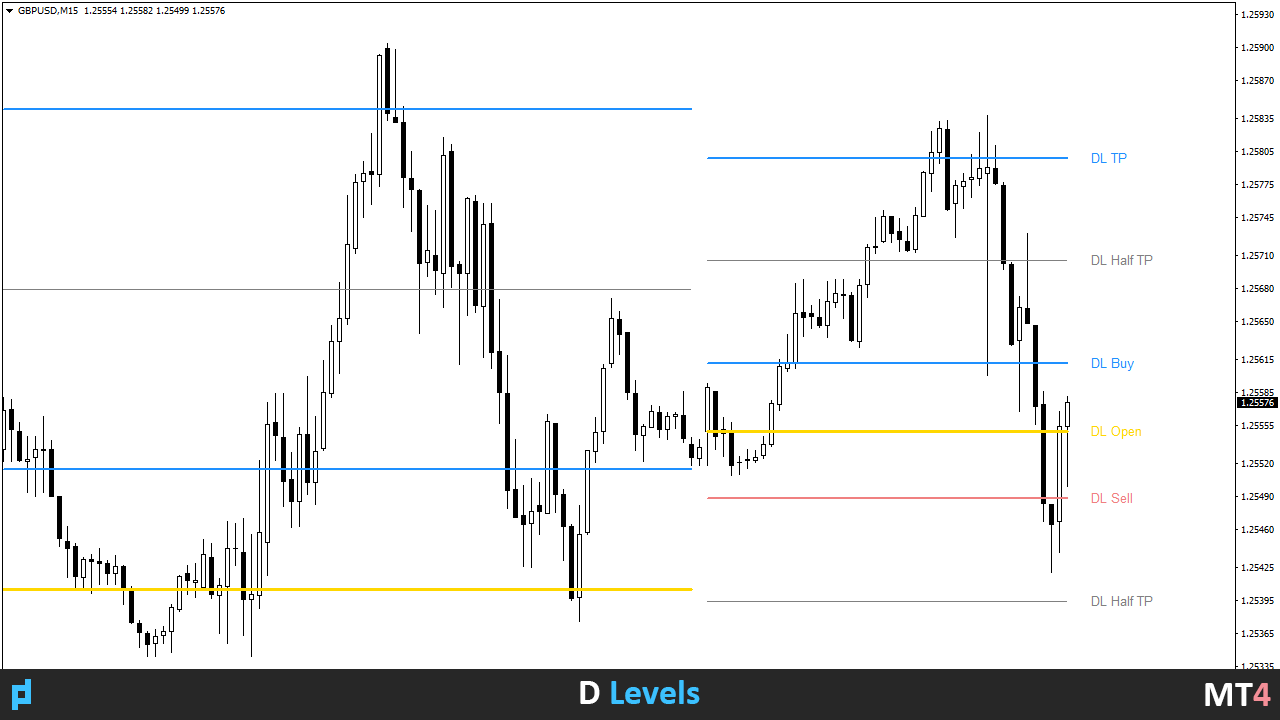
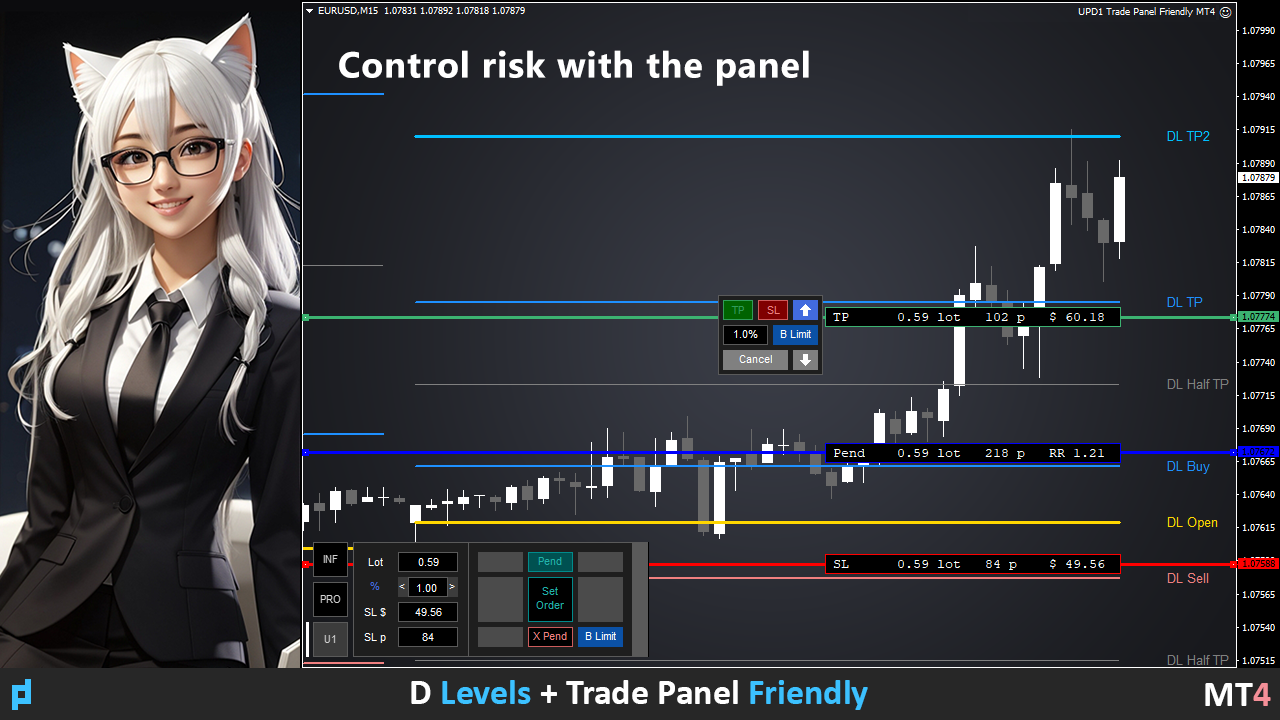
Levels indicator based on the previous day.

Mathematical formula determines entry and exit levels. 


Trading recommendations.

Levels are traded at the beginning of the European session when volatility appears.

In case of insufficient volatility use half of take profit to exit.

If the price reversed at half take profit, then on the reversal look for a target also at the level of half take profit.

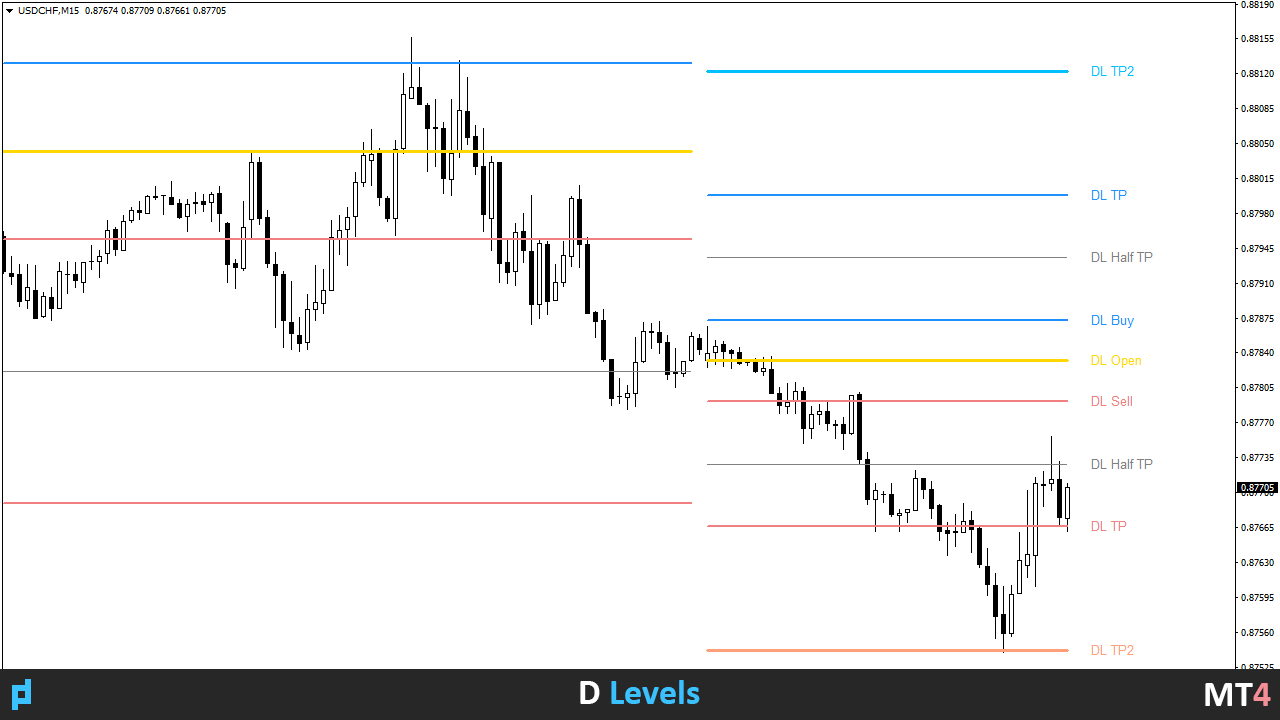
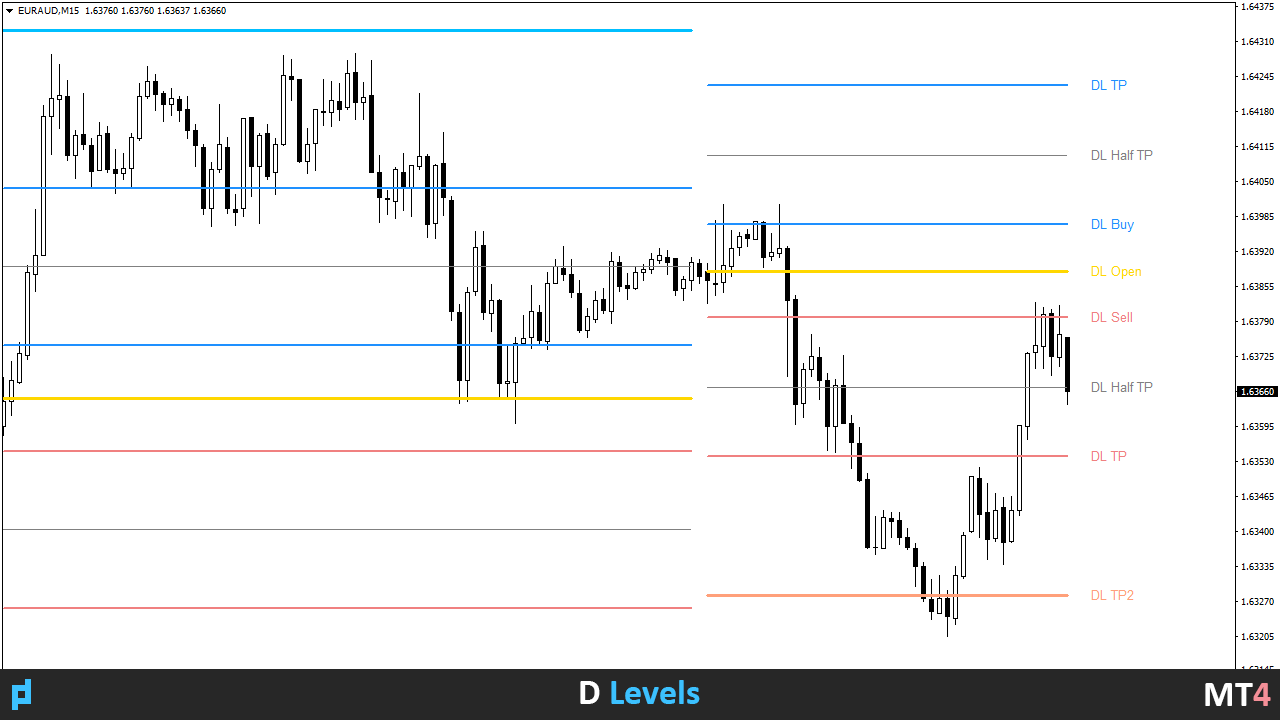
If the price bounced from the entry level, then in the opposite direction the price can reach the second take profit.


You should not always enter on the breakout. It is advisable to wait for a retest (breakout of the level and a test from the opposite side).

Retests work well if there are several levels of minimum volume in the market. See the UPD1 Profile Levels indicator.


Input Parametres.


Start Hour - from which hour to start the day. 00 - default.


Visual Button - button display (on/off).

Corner - angle of button binding.

X indent - horizontal indent in pixels.

Y indent - vertical indent in pixels.


Label Visual - display the level label.

Label Font Size - font size.

Label Shift Bars - indent the inscription in bars.

Label Tooltip - display the inscription under the cursor above the level.


Levels Style - style of line drawing.

Levels Width - width of line drawing.

Levels Color - color of line drawing.


Alert - enable/disable the alert.

Alert Work Time - Alert Work Time 00:00-23:59 (editable).

Alert Pop Up - pop up window.

Alert Push - alert in the application.

Alert Email - notification to mail.

Alert Sound - enable or disable sound.

Alert Sound Name - the sound file.


Recommended products
Free automatic Fibonacci is an indicator that automatically plots a Fibonacci retracement based on the number of bars you select on the BarsToScan setting in the indicator. The Fibonacci is automatically updated in real time as new highest and lowest values appears amongst the selected bars. You can select which level values to be displayed in the indicator settings. You can also select the color of the levels thus enabling the trader to be able to attach the indicator several times with differe
FREE
Wicks UpDown Target GJ Wicks UpDown Target GJ is specialized in GJ forex pairs. Choppy movement up and down on the opening range every day.  Trading breakouts on London session and New York session is recommended. Guideline Entry Strategy Idea: Step 1 - Breakout Forming (Warning! Trade on London Session and New York Session) Step 2 - Breakout Starting (Take Action on your trading plan) Step 3 - Partial Close your order & set breakeven (no-risk) Step 4 - Target complete Step 5 - Don't tr
FREE
Extremum Reverse Bar
Yurij Izyumov
2.8 (5)
This indicator has been created for finding the probable reversal points of the symbol price. A small candlestick reversal pattern is used it its operation in conjunction with a filter of extremums. The indicator is not redrawn! If the extremum filter is disabled, the indicator shows all points that have a pattern. If the extremum filter is enabled, the condition works – if the history Previous bars 1 candles back contains higher candles and they are farther than the Previous bars 2 candle, such
FREE
Pivot Point Fibo RSJ is an indicator that traces the support and resistance lines of the day using Fibonacci rates. This spectacular indicator creates up to 7 levels of support and resistance through Pivot Point using Fibonacci rates. It is fantastic how the prices respect each level of this support and resistance, where it is possible to perceive possible entry/exit points of an operation. Features Up to 7 levels of support and 7 levels of resistance Set the colors of the levels individual
FREE
Follow The Line
Oliver Gideon Amofa Appiah
4 (13)
FOLLOW THE LINE GET THE FULL VERSION HERE: https://www.mql5.com/en/market/product/36024 This indicator obeys the popular maxim that: "THE TREND IS YOUR FRIEND" It paints a GREEN line for BUY and also paints a RED line for SELL.  It gives alarms and alerts of all kinds. IT DOES NOT REPAINT and can be used for all currency pairs and timeframes. Yes, as easy and simple as that. Even a newbie can use it to make great and reliable trades. NB: For best results, get my other premium indicators for more
FREE
TrendPlus
Sivakumar Subbaiya
4 (11)
Trend Plus   Trendplus  Indicator   Time Frame: Suitable for any time frame.  Purpose: Trend Prediction. Blue and red candle indicate the buy and sell call respectively. Buy: When the blue candle is formed buy call is initiated. close the buy trades when the next red candle will formed.   Sell: When the Red candle is formed Sell call is initiated. close the Sell trades when the next blue candle will formed.   Happy trade!!
FREE
This indicator shows the latest untouched support and resistance as horizontal lines. The indicator can show support/resistance from higher timeframes. With this indicator you can e.g. easily see the support/resistance of the timeframes H4, D1 and W1 on a H1 chart, which can be a big advantage while time your entry on H1. This is the FREE version of the indicator: Support Resistance Multi Time Frame The free version works only on EURUSD and GBPUSD! Parameters referenceTF: the timeframe from wh
FREE
AdvanceZigZag
Gholamreza Mohammad Mojaveri
5 (1)
AdvaneZigZag Indicator Are you tired of the limitations of the traditional ZigZag indicator? Meet AdvaneZigZag, the ultimate tool to simplify your market structure analysis and enhance your trading strategies. Designed with flexibility and precision in mind, AdvaneZigZag brings you advanced features to navigate the market with confidence. Key Features: 1. Enhanced Flexibility:    - While maintaining the familiar simplicity of the conventional ZigZag indicator, AdvaneZigZag offers superi
FREE
Toby Strategy Indicator
Ahmd Sbhy Mhmd Ahmd ʿYshh
The indicator rely on The Toby strategy >> The mother candle which is bigger in range than the previous six candles. A vertical line shows the last Toby Candle with the targets shown up and down. The strategy is about the closing price out of the range of the toby candle to reach the 3 targets..The most probable to be hit is target1 so ensure reserving your profits and managing your stop lose.
FREE
COG LR Osc AM
Andriy Matviyevs'kyy
The presented indicator allows you to determine potential entry points into the market and set protective orders at reasonable levels. This product can be useful for both beginners and experienced traders. The indicator is based on calculation methods proven by time and practicing traders. The indicator is calculated in two stages: At the first stage, linear regression (LR) of the selected price type is determined for a given number of chart periods. At the second stage, the obtained data is p
FREE
Trend Catcher with Alert
Issam Kassas
4.74 (39)
The Trend Catcher: The Trend Catcher Strategy with Alert Indicator is a versatile technical analysis tool that aids traders in identifying market trends and potential entry and exit points. It features a dynamic Trend Catcher Strategy , adapting to market conditions for a clear visual representation of trend direction. Traders can customize parameters to align with their preferences and risk tolerance. The indicator assists in trend identification, signals potential reversals, serves as a trail
FREE
Not trading time
Mikhail Nazarenko
4 (2)
There are time periods in the market, when trading is highly likely to be unprofitable. This indicator warns you about such non-trading situations and helps you preserve your money and time. Parameters Remind about non-trading periods: Expiration week - remind about the expiration week Consumer index day - remind a day before the release of Consumer index day NON FARM - remind a day before the release of NON FARM Christmas - remind a day before Christmas New Year Days 25.12 - 15.01 - remind ab
FREE
Market Profile 3
Hussien Abdeltwab Hussien Ryad
1 (1)
Market Profile 3 MetaTrader 4 indicator  — is a classic Market Profile implementation that can show the price density over time, outlining the most important price levels, value area, and control value of a given trading session. This indicator can be attached to timeframes between M1 and D1 and will show the Market Profile for daily, weekly, monthly, or even intraday sessions. Lower timeframes offer higher precision. Higher timeframes are recommended for better visibility. It is also possible t
FREE
Head and Shoulders Pattern Indicator - Your Key to Recognizing Trend Reversals Unlock the power of pattern recognition with the "Head and Shoulders Pattern Indicator." This cutting-edge tool, designed for MetaTrader, is your trusted ally in identifying one of the most powerful chart patterns in technical analysis. Whether you're a novice or an experienced trader, this indicator simplifies the process of spotting the Head and Shoulders pattern, allowing you to make informed trading decisions. Key
FREE
Welcome to our   Price Wave Pattern   MT4 --(ABCD Pattern)-- The ABCD pattern is a powerful and widely used trading pattern in the world of technical analysis. It is a harmonic price pattern that traders use to identify potential buy and sell opportunities in the market. With the ABCD pattern, traders can anticipate potential price movements and make informed decisions on when to enter and exit trades. EA Version : Price Wave EA MT4 MT5 version : Price Wave Pattern MT5 Features :  Aut
FREE
Zigzag Extremum points
Oleg Popov
4.8 (30)
New version 8.00 is available. In this version, I tried to take into account the wishes of the user. Each of you can also take part in the improvement of this advisor. In the default settings, the adviser opens trades when the extremum point is broken       standard indicator       Zigzag. When the upper point of the zigzag extremum is broken, it opens a buy deal, and when the lower point of the zigzag extremum is broken, it opens a sell deal. In addition to the standard ZigZag indicator, whi
FREE
FREE UNLIMITED PM : https://linktr.ee/ARFXAUTOTRADE?utm_source=linktree_admin_share Trend Line is very useful for trader friends, both for mapping following trends and counter trends, here I am sharing an auto trend line indicator I made that you can use to make it easier for you to see the market.  How to use trend line:  01. Follow our trend, wait for the trend line to return and touch our trend line and form a continuation pattern on the candle stick 02. Counter Trend We wait for 1 ca
FREE
PZ Fibonacci
PZ TRADING SLU
4.8 (10)
Are you tired of plotting fibonacci retracements or extensions manually? This indicator displays fibonacci retracements or extensions automatically, calculated from two different price points, without human intervention or manual object anchoring.  [ Installation Guide | Update Guide | Troubleshooting | FAQ | All Products ] Easy to use Manual anchoring is not needed Perfect for price confluence studies The indicator evaluates if retracements or extensions are needed Once drawn, you can manually
FREE
Trend arrow Indicator
NGUYEN NGHIEM DUY
3.5 (8)
Trend arrow Indicator is an arrow Indicator used as an assistant tool for your trading strategy. The indicator analyzes the standard deviation of bar close for a given period and generates a buy or sell signals if the deviation increases. It good to combo with Martingale EA to follow Trend and Sellect Buy Only/Sell Only for EA work Semi-Automatic. You can use this  Indicator with any EAs in my Products.
FREE
Rainbow MT4
Jamal El Alama
Rainbow MT4 is a technical indicator based on Moving average with period 34 and very easy to use. When price crosses above MA and MA changes color to green, it’s a signal to buy. When price crosses below MA and MA changes color to red, it’s a signal to sell. The Expert advisor ( Rainbow EA MT4) based on Rainbow MT4 indicator, as you can see in the short video below is now available here .
FREE
This indicator alerts you when/before new 1 or 5 minute bar candle formed. In other words,this indicator alerts you every 1/5 minutes. This indicator is especially useful for traders who trade when new bars formed. *This indicator don't work propery in strategy tester.Use this in live trading to check functionality. There is more powerful Pro version .In Pro version,you can choose more timeframe and so on. Input Parameters Alert_Or_Sound =Sound ----- Choose alert or sound or both to not
FREE
Are you tired of drawing trendlines every time you're analyzing charts? Or perhaps you would like more consistency in your technical analysis. Then this is for you. This indicator will draw trend lines automatically when dropped on a chart. How it works Works similar to standard deviation channel found on mt4 and mt5. It has 2 parameters: 1. Starting Bar 2. Number of bars for calculation The   starting bar   is the bar which drawing of the trend lines will begin, while the   number of bars for c
FREE
Wave Reversal Indicator - determines the direction of trend waves and price reversals. The indicator shows wave movements and trend directions. It gives recommendations where to follow the trader, helps to follow the trading strategy. It is an addition to an intraday or medium-term strategy. Almost all parameters are selected for each time frame and are changed automatically, the only parameter for manual adjustment is the wavelength. Works on various trading instruments and timeframes, rec
FREE
This indicator scans for you up to 30 trading instruments and up to 8 timeframes for occurrences of the high probability reversal patterns: Double Tops/Bottoms with fake breakouts . Please read also the blog post " Professional Trading With Double Tops/Bottoms And Divergences! " which explains the concepts behind the ULTIMATE Double Top/Bottom indicator and how you can use a professional top-down approach. This FREE Version of the Scanner scans only EURUSD and GBPUSD. The full version of the sca
FREE
Show Pips
Roman Podpora
4.31 (51)
This information indicator will be useful for those who always want to be aware of the current situation on the account. The indicator displays data such as profit in points, percentage and currency, as well as the spread for the current pair and the time until the bar closes on the current timeframe. VERSION MT5 - More useful indicators There are several options for placing the information line on the chart: 1. To the right of the price (runs behind the price); 2. As a comment (in the up
FREE
High Low Open Close MT4
Alexandre Borela
4.75 (16)
If you like this project, leave a 5 star review. Follow on instagram: borelatech This indicator draws the open, high, low and closing prices for the specified period and it can be adjusted for a specific timezone. These are important levels looked by many institutional and professional traders and can be useful for you to know the places where they might be more active. The available periods are: Previous Day. Previous Week. Previous Month. Previous Quarter. Previous year. Or: Current Day. Cu
FREE
This indicator is one of the useful tools for traders who trade on currency pairs and based on the strength of each currency they can make a correct decision or confirmation in the positions.  It has been calculated for all the minor currency pairs supported by the broker and displays the values of the major currencies. These currencies are displayed horizontally or vertically according to the trader's config when executing the indicator. One of the trading strategies that can be used is to cho
FREE
Traditional MACD MT4
Daniel Lewis
4.56 (50)
MACD indicator in MetaTrader 4/5 looks different than MACD does in most other charting software. That is because the MetaTrader 4/5 version of MACD displays the MACD line as a histogram when it is traditionally displayed as a line. Additionally, the MetaTrader 4/5 version computes the Signal line using an SMA, while according to MACD definition it is supposed to be an EMA. The MetaTrader 4/5 version also does not compute a true MACD Histogram (the difference between the MACD/Signal lines). This
FREE
The indicator displays price distribution on a horizontal histogram. Horizontal histogram help find out key levels of price so that you can make good decision on setting point of take profit, stop loss... You can improve exist trading strategy or get new trading idea with the histogram of price. Outstanding features Support multiple time frame : you can choose to work with history data in any time frame you want. It does not depend on current display time frame. Support weighting by volume a
FREE
5/35 Oscillator to be used with our Elliott Wave Indicator as part of the overall strategy on trading the 5th wave. The Elliott Wave Indicator Suite is designed around a simple but effective Swing Trading Strategy. The Indicator Suite is great for Stocks, Futures and Forex trading on multiple timeframes You can find the main Elliott Wave Indicator here  https://www.mql5.com/en/market/product/44034
FREE
Buyers of this product also purchase
Gann Made Easy
Oleg Rodin
4.88 (102)
Gann Made Easy is a professional and easy to use Forex trading system which is based on the best principles of trading using the theory of mr. W.D. Gann. The indicator provides accurate BUY and SELL signals including Stop Loss and Take Profit Levels. You can trade even on the go using PUSH notifications. PLEASE CONTACT ME AFTER PURCHASE TO GET MY TRADING TIPS PLUS A GREAT BONUS! Probably you heard already many times about Gann trading methods. Usually Gann's theory is very complex thing not only
Trend Punch
Mohamed Hassan
5 (11)
This indicator is unstoppable when combined with our other indicator called  Support & Resistance . After purchase, send us a message and you will get it   for  FREE as a BONUS! Introducing Trend Punch , the revolutionary forex trend indicator that will transform the way you trade! Trend Punch is uniquely designed to provide precise buy and sell arrows during strong market trends, making your trading decisions clearer and more confident. Whether you're trading major currency pairs or exotic sym
FX Power MT4 NG
Daniel Stein
5 (12)
Trading GOLD, and currencies, with the dog walk strategy  - super smart Trading GOLD, and currencies, with the breakout strategy  - super easy Visit our all-new   Stein Investments Welcome Page   to get the latest information, updates and trading strategies. FX Power MT4 NG  is the next generation of our long-time very popular currency strength meter, FX Power.  And what does this next-generation strength meter offer? Everything you have loved about the original FX Power  PLUS GOLD/XAU stre
Gold Stuff
Vasiliy Strukov
4.89 (201)
Gold Stuff is a trend indicator designed specifically for gold and can also be used on any financial instrument. The indicator does not redraw and does not lag. Recommended time frame H1. At it indicator work full auto  Expert Advisor EA Gold Stuff. You can find it at my profile. Contact me immediately after the purchase to get   personal bonus!  You can get a free copy of our Strong Support and Trend Scanner indicator, please pm. me! Settings  and manual here   SETTINGS Draw Arrow - on off. dra
PLEASE READ THE INFO DOWN BELOW BEFORE PURCHASING THE PRODUCT! Apollo Pips PLUS SP is a unique product!  IT IS FOR THOSE WHO WANT TO GET MY NEW "APOLLO PIPS" INDICATOR PLUS "SUPER PACK" BONUS WITH ACCESS TO ALL MY TRADING INDICATORS! By purchasing the Apollo Pips PLUS SP product you're actually purchasing an absolutely new version of my Apollo Pips indicator. This version of the indicator has got an improved algorithm and an easy to use parameter which gives you the opportunity to use the indica
TPSproTREND PrO
Roman Podpora
4.78 (18)
TPSpro TRENDPRO  - is a trend indicator that automatically analyzes the market and provides information about the trend and each of its changes, as well as giving signals for entering trades without redrawing! The indicator uses each candle, analyzing them separately. referring to different impulses - up or down impulse. Exact entry points into transactions for currencies, crypto, metals, stocks, indices!  Version MT5             DETAILED DESCRIPTION              R ecommended to use with an indi
Trend Pulse
Mohamed Hassan
5 (3)
Please contact me after purchase to immediately get your PDF strategy + documentation for Trend Pulse !  Official release price of $89  (2 /50 copies left). Next price is $199 . Introducing Trend Pulse , a unique and robust indicator capable of detecting bullish, bearish, and even ranging trends! Trend Pulse uses a special algorithm to filter out market noise with real precision. If the current symbol is moving sideways, Trend Pulse will send you a ranging signal, letting you know that it'
Scalper Inside PRO
Alexey Minkov
4.69 (49)
An exclusive indicator that utilizes an innovative algorithm to swiftly and accurately determine the market trend. The indicator automatically calculates opening, closing, and profit levels, providing detailed trading statistics. With these features, you can choose the most appropriate trading instrument for the current market conditions. Additionally, you can easily integrate your own arrow indicators into Scalper Inside Pro to quickly evaluate their statistics and profitability. Scalper Inside
Currency Strength Wizard is a very powerful indicator that provides you with all-in-one solution for successful trading. The indicator calculates the power of this or that forex pair using the data of all currencies on multiple time frames. This data is represented in a form of easy to use currency index and currency power lines which you can use to see the power of this or that currency. All you need is attach the indicator to the chart you want to trade and the indicator will show you real str
Atomic Analyst
Issam Kassas
5 (2)
First of all Its worth emphasizing here that this Trading Indicator is   Non-Repainting , Non Redrawing and Non Lagging Indicator   Indicator, Which makes it ideal from both manual and robot trading.  User manual: settings, inputs and strategy . The Atomic Analyst  is a PA Price Action Indicator that uses Strength and Momentum of the price to find a better edge in the market. Equipped with Advanced filters which help remove noises and false signals, and Increase Trading Potential. Using Multipl
- Real price is 80$ - 40% Discount ( It is 49$ now ) Contact me for instruction, any questions! Introduction The breakout and retest strategy is traded support and resistance levels. it involves price breaking through a previous level.  The break and retest strategy is designed to help traders do two main things, the first is to avoid false breakouts. Many false breakouts start with a candlestick that breaks out of a level but ends with an immediate candlestick that brings the price back into t
RelicusRoad Pro
Relicus LLC
4.54 (80)
How many times have you bought a trading indicator with great back-tests, live account performance proof with fantastic numbers and stats all over the place but after using it, you end up blowing your account? You shouldn't trust a signal by itself, you need to know why it appeared in the first place, and that's what RelicusRoad Pro does best! NOW $147 (increasing to $499 after a few updates) - UNLIMITED ACCOUNTS (PCs or MACs) **  User Manual + Strategies + Training Videos + Private Group with
Currently 20% OFF ! Best Solution for any Newbie or Expert Trader! This dashboard software is working on 28 currency pairs plus one. It is based on 2 of our main indicators (Advanced Currency Strength 28 and Advanced Currency Impulse). It gives a great overview of the entire Forex market plus Gold or 1 indices. It shows Advanced Currency Strength values, currency speed of movement and signals for 28 Forex pairs in all (9) timeframes. Imagine how your trading will improve when you can watch the e
Clear Breakout
Martin Alejandro Bamonte
The "Breakout Buy-Sell" indicator is designed to identify and highlight potential buy and sell opportunities based on price breakouts during different market sessions (Tokyo, London, and New York). This indicator helps traders clearly visualize buy and sell zones, as well as take-profit (TP) and stop-loss (SL) levels. Usage Strategy The indicator can be used as follows: Initial Setup : Select the market session and adjust the GMT offset. Market Visualization : Observe the breakout boxes drawn at
Trend Screener
STE S.S.COMPANY
4.79 (81)
Unlock the Power of Trends Trading with the Trend Screener Indicator: Your Ultimate Trend Trading Solution powered by Fuzzy Logic and Multi-Currencies System! Elevate your trading game with the Trend Screener, the revolutionary trend indicator designed to transform your Metatrader into a powerful Trend Analyzer. This comprehensive tool leverages fuzzy logic and integrates over 13 premium features and three trading strategies, offering unmatched precision and versatility. LIMITED TIME OFFER : Sup
CURRENTLY 31% OFF !! Best Solution for any Newbie or Expert Trader! This indicator is a unique, high quality and affordable trading tool because we have incorporated a number of proprietary features and a secret formula. With only ONE chart it gives Alerts for all 28 currency pairs. Imagine how your trading will improve because you are able to pinpoint the exact trigger point of a new trend or scalping opportunity! Built on new underlying algorithms it makes it even easier to identify and confir
CURRENTLY 26% OFF Best Solution for any Newbie or Expert Trader! This Indicator is a unique, high quality and affordable trading tool because we have incorporated a number of proprietary features and a new formula. With only ONE chart you can read Currency Strength for 28 Forex pairs! Imagine how your trading will improve because you are able to pinpoint the exact trigger point of a new trend or scalping opportunity? User manual: click here That's the first one, the original! Don't buy a worthle
PRO Renko System
Oleg Rodin
5 (23)
PRO Renko System is a highly accurate trading system specially designed for trading RENKO charts. The ARROWS and Trend Indicators DO NOT REPAINT! The system effectively neutralizes so called market noise giving you access to accurate reversal signals. The indicator is very easy to use and has only one parameter responsible for signal generation. You can easily adapt the tool to any trading instrument of your choice and the size of the renko bar. I am always ready to provide extra support to help
Gold Channel is a volatility-based indicator, developed with a specific timing algorithm for the XAUUSD pair, which consists of finding possible corrections in the market. This indicator shows two outer lines, an inner line (retracement line) and an arrow sign, where the theory of the channel is to help identify overbought and oversold conditions in the market. The market price will generally fall between the boundaries of the channel. If prices touch or move outside the channel it is a tra
First of all Its worth emphasizing here that this Trading Tool is Non-Repainting Non-Redrawing and Non-Lagging Indicator Which makes it ideal for professional trading . Online course, user manual and demo. The Smart Price Action Concepts Indicator is a very powerful tool for both new and experienced traders . It packs more than 20 useful indicators into one combining advanced trading ideas like Inner Circle Trader Analysis and Smart Money Concepts Trading Strategies . This indicator focuses on
NAM Order Blocks
NAM TECH GROUP, CORP.
5 (1)
MT4 Multi-timeframe Order Blocks detection indicator. Features - Fully customizable on chart control panel, provides complete interaction. - Hide and show control panel wherever you want. - Detect OBs on multiple timeframes. - Select OBs quantity to display. - Different OBs user interface. - Different filters on OBs. - OB proximity alert. - ADR High and Low lines. - Notification service (Screen alerts | Push notifications). Summary Order block is a market behavior that indicates order collection
PZ Trend Trading
PZ TRADING SLU
4.8 (5)
Capture every opportunity: your go-to indicator for profitable trend trading Special Offer: Purchase now to receive free bonuses worth $159! (Read more for details) Trend Trading is an indicator designed to profit as much as possible from trends taking place in the market, by timing pullbacks and breakouts. It finds trading opportunities by analyzing what the price is doing during established trends. [ Installation Guide | Update Guide | Troubleshooting | FAQ | All Products ] Trade financial
TPSpro RFI Levels
Roman Podpora
4.8 (20)
Reversal First Impulse levels (RFI)    INSTRUCTIONS        RUS       -       ENG              R ecommended to use with an indicator   -   TPSpro  TREND PRO -  Version MT5 A key element in trading is zones or levels from which decisions to buy or sell a trading instrument are made. Despite attempts by major players to conceal their presence in the market, they inevitably leave traces. Our task was to learn how to identify these traces and interpret them correctly. Main functions: Displaying activ
Order Block Hunter
Noha Mohamed Fathy Younes Badr
5 (1)
Order block hunter indicator is the best indicator for  hunt the order blocks that area where there has been a large concentration of limit orders waiting to be executed Order blocks are identified on a chart by observing previous price action and looking for areas where the price experienced significant movement or sudden changes in direction .This indicator does that for you by using very complicated codes and helps you to take the best areas To buy and sell because it make marks at the best a
Scalper Vault
Oleg Rodin
5 (22)
Scalper Vault is a professional scalping system which provides you with everything you need for successful scalping. This indicator is a complete trading system which can be used by forex and binary options traders. The recommended time frame is M5. The system provides you with accurate arrow signals in the direction of the trend. It also provides you with top and bottom signals and Gann market levels. The indicator provides all types of alerts including PUSH notifications. PLEASE CONTACT ME AFT
M1 Arrow
Oleg Rodin
4.67 (12)
M1 Arrow is an indicator which is based on natural trading principles of the market which include volatility and volume analysis. The indicator can be used with any time frame and forex pair. One easy to use parameter in the indicator will allow you to adapt the signals to any forex pair and time frame you want to trade. The Arrows DO NOT REPAINT and DO NOT LAG! The algorithm is based on the analysis of volumes and price waves using additional filters. The intelligent algorithm of the indicato
IX Power MT4
Daniel Stein
5 (5)
IX Power finally brings the unbeatable precision of FX Power to all your trading symbols. It accurately determines the intensity of short, medium and long-term trends in your favourite indices, stocks, commodities, ETFs, and even cryptocurrencies. You can analyse everything your terminal has to offer. Try it out and experience how your timing improves significantly when trading. Read about our latest strategic development -  Easy scalping with IX Power Visit our all-new   Stein Investments
Backtest and Read Overview before purchase. Chart patterns have been a topic of debate among traders; some believe they are reliable signalers, while others do not. Our Chart Patterns All-in-One indicator displays various chart patterns to help you test these theories for yourself. The profitability of these patterns is not a reflection of the indicator's effectiveness but rather an evaluation of the patterns themselves. The Chart Patterns All-in-One indicator is an excellent tool for visualizin
Advanced Supply Demand
Bernhard Schweigert
4.9 (271)
CURRENTLY 26% OFF !! Best Solution for any Newbie or Expert Trader! This indicator is a unique, high quality and affordable trading tool because we have incorporated a number of proprietary features and a new formula. With this update, you will be able to show double timeframe zones. You will not only be able to show a higher TF but to show both, the chart TF, PLUS the higher TF: SHOWING NESTED ZONES. All Supply Demand traders will love it. :) Important Information Revealed Maximize the potenti
Break and Retest
Mohamed Hassan
3.83 (12)
This Indicator only places quality trades when the market is really in your favor with a clear break and retest. Patience is key with this price action strategy! If you want more alert signals per day, you increase the number next to the parameter called: Support & Resistance Sensitivity.  After many months of hard work and dedication, we are extremely proud to present you our  Break and Retest price action indicator created from scratch. One of the most complex indicators that we made with ove
More from author
The indicator builds a three-period semaphore and reversal pattern 123 from the extremum. The signal comes at the opening of the second candle. This pattern can be traded in different ways (test point 3, breakout and others). Exit from the channel or breakout of the trendline is the main trigger for finding an entry point. Icons are colored according to Fibonacci levels. Yellow icons indicate a test of a level at which the signal is amplified. Using the multi-currency dashboard, you can track w
UPD1 Profile Levels
Vitaliy Kuznetsov
5 (5)
The indicator finds the levels of the maximum and minimum price volume (market profile) on the working histogram for the specified number of bars.  Composite profile . The height of the histogram is fully automatic and adapts to any instrument and timeframe. The author's algorithm is used and does not repeat well-known analogues. The height of the two histograms is approximately equal to the average height of the candle. Smart alert will help you to inform about the price concerning the volume
UPD1 Volume BOX
Vitaliy Kuznetsov
5 (12)
The indicator displays the horizontal volume profile in the specified area (BOX) and the maximum volume (POC). Product Features. 1. You can use ticks or just price. 2. Adaptive grid spacing (M1-MN). 3. Adaptive high volume (median) search step depending on box size. 4. Automatic chameleon color for box lines and buttons. 5. Multiple boxes, easy to create and delete. 6. 70% volume area (enable in settings). 7. There is an alert for touching the maximum horizontal volume line (POC). 8. VWAP. 9.
The indicator shows a signal on the chart when the second candlestick is inside the first candlestick, i.e. has not gone beyond its limits. This candlestick pattern is called the Inside Bar. This pattern is not as popular as Pin Bar or Engulfing, but it is sometimes used by some traders. There is a possibility to filter by trend (2 moving averages) and by reversal (RSI and Bollinger Bands). Multicurrency panel is available. With its help you can easily switch between charts. Trading patterns:
UPD1 Volume Cluster
Vitaliy Kuznetsov
4.73 (11)
The algorithm finds the zones of reduced volatility based on the UPD1 Trend Direction Indicator and builds the maximum horizontal volume based on the UPD1 Volume Box Indicator . As a rule, a strong trend movement occurs when exiting accumulation. If the price has left the accumulation, then it can test its maximum horizontal volume (POC). Smart alerts are available in the settings. Input parameters. Main Settings. Bars Count – the number of history bars on which the indicator will work. Tim
FREE
UPD1 Trend Direction
Vitaliy Kuznetsov
4.75 (8)
This indicator is used to display the places of the flat and trend. The construction is based on an oscillator. It is used as an additional filter, both for trading on a regular chart and for binary options. Flat places are used in the UPD1 Volume Cluster indicator for trading according to the concept of smart money The built-in alert signals the places of the greatest overbought/oversold. Input parameters. Main Settings. Bars Count - indicate the number of bars on which the trend direction
FREE
UPD1 Impulse Level
Vitaliy Kuznetsov
5 (6)
The indicator finds impulse waves on the chart. Analyzes the breakdown of the fractal channel and builds impulse levels . In addition, it finds the alleged places of false breakouts and liquidity grabs . In the settings, you can enable a multi-currency dashboard and select any tools and timeframes. Notification Choose between the current schedule or the entire list. There are separate impulse and false breakdown signals. Blog-Link -  Retest and Fake Breakout with UPD1 . Trade Patterns: + Ret
UPD1 Volume Footer
Vitaliy Kuznetsov
4.9 (10)
The indicator shows the vertical volume. In the settings there are 2 coefficients for determining high and extreme volume and 1 for determining low volume. A similar algorithm is also used in the UDP1 Volume Pixel indicator . When the specified volume is detected, the histogram is painted in the appropriate color. The width of the histogram is selected automatically, depending on the scale. As a rule, the price reacts to the maximum and minimum volume. But it is necessary to use confirmation si
FREE
The indicator displays the "Rails" pattern on the chart. This pattern consists of two multidirectional candles with identical bodies and small shadows. If on the current timeframe the pattern "Rails", then on the x2 timeframe it will look like a Pin Bar (Doji). This indicator was created to automatically find the pattern in the most efficient way with logically simple settings that you can easily change. There is an option to filter by trend (2 moving averages) and reversal (RSI and Bollinger B
UPD1 Volume TimeFrame POC
Vitaliy Kuznetsov
5 (2)
The indicator display the maximum horizontal volume on the selected timeframe. Based on the UPD1 Volume Box indicator . The lines can be connected or separated. In the settings, you can enable smart touch alert. Such an indicator will be useful for those who trade according to the market profile and the concept of smart money. Input parameters. Main Settings. Bars Count - indicate the number of bars on which the TF POC will be drawn. Data Source - the time frame from which the ticks will be
FREE
The meaning of this indicator is to   find Murray levels on all timeframes   and combine them into   combo levels , including signal levels based on strong Murray levels (+2, +1, 8, 4, 0, -1, -2). The lower the timeframe, the more chances you have to see the combo level immediately. It will be highlighted in color. When you hover over any number, a hint will pop up to which timeframe the level belongs to. But you will always see the current timeframe as the leftmost one. A  smart alert  will he
UPD1 X00 Levels
Vitaliy Kuznetsov
5 (6)
The indicator shows   round levels   on the chart. They are also called   psychological , banking, or levels of major players. At these levels, there is a real fight between bulls and bears, the accumulation of many orders, which leads to increased volatility. The indicator   automatically   adjusts to any instrument and timeframe. When the   level 80   is broken through and then tested, we   buy. When   level 20   is broken through and then tested, we   sell. The target is 00. Attention. Due t
FREE
The indicator shows signals based on the terminal RSI oscillator on the chart. It is possible to filter out repeated signals. Here the oscillator is used to search for a reverse signal. It is recommended as an entry point in swing strategies and trading from levels. A multi-currency dashboard is available. With it, you can easily switch between charts. In product discussions, you can suggest an algorithm in which you can embed a dashboard. Input parameters. Main Settings. Bars Count – t
FREE
UPD1 Volume Pixel
Vitaliy Kuznetsov
5 (3)
The indicator finds the low, high, extreme volume based on the specified coefficients and paints them in the specified colors. This replaces the standard volume drawing function in the metatrader terminal. Bars can also be painted in the color of the volume. On bars with extreme volume, the maximum horizontal volume (cluster/POC) is determined. Depending on its location (pushing, neutral, stopping), the cluster also has its own color. If the cluster is in the shadow, and the bar has an extreme
UPD1 Pin Bar Dashboard
Vitaliy Kuznetsov
5 (2)
An indicator that displays the Pin Bar candlestick pattern. With the help of coefficient settings, the ratio of shadow, body and size is easily adjusted. It is possible to filter by trend (2 moving averages) and by reversal (RSI and Bollinger Bands). This is the most popular price action pattern. A multi-currency dashboard is available. With it, you can easily switch between charts. Trading Patterns: Retest by trend. False breakout. Other. EURUSD, GBPUSD, XAUUSD, ... M15, M30, H1. Input p
An indicator that displays the Engulfing candlestick pattern. In the settings, you can specify the type of engulfing (body, shadow and combination). It is possible to filter by trend (2 moving averages) and by reversal (RSI and Bollinger Bands). This is a very popular price action pattern. A multi-currency dashboard is available. With it, you can easily switch between charts. Trading Patterns: Retest by trend. False breakout. Order Block. Other. EURUSD, GBPUSD, XAUUSD, ... M15, M30, H1. I
Trading panel with preset orders and automatic lot calculation for the MT4 terminal. Attention, the Trading Panel does not work in the strategy tester (only trailing stop testing). Manual, Description, Download Light Demo. Successful traders are distinguished by self-discipline and competent money management. If you use a fixed lot, then you are at risk. After all, there are different distances on different timeframes and one unprofitable transaction can cover several profitable ones. If you use
The Average True Range ( ATR ) is a measure of market volatility over a specified number of days. You should not expect a big continuation move when the price has reached the end of the range. The market is considered to have run out of fuel. If the price has not reached the edge, it still has a range. The indicator formula allows you to calculate High-Low levels both in aggregate and individually. You can also use these levels as support/resistance and target. Input parameters. Start Day -
FREE
UPD1 Watermark MT4
Vitaliy Kuznetsov
5 (1)
The indicator shows any text and any image on the chart, and can also output the information requested by macros. There are three text blocks and one block for images. Available font selection, size, color, indentation and positioning. If you want to brand your screenshots or display the necessary information on a graph, then UPD1 Watermark will be a very useful tool. Description of settings. Text Settings (3 blocks). Text 1, 2, 3 – enter the text and, or a macro. Font Name – write the font
FREE
UPD1 Murrey Math Levels
Vitaliy Kuznetsov
5 (6)
Murray's mathematical levels are based on observations by Gann and his theory of the squareness of prices. According to Gann, the price moves in 1/8 of the range. These 1/8 allow us to get different resistance and support levels for a given chart, which have their own characteristics. After a breakout of -2 or +2 levels, or with a decrease in volatility, they are rebuilt. You can choose which period to display (current or entire history). All lines are drawn through buffers. Blog-Link -   Murrey
FREE
The indicator shows   round levels   on the chart. They are also called   psychological , banking, or levels of major players. At these levels, there is a real fight between bulls and bears, the accumulation of many orders, which leads to increased volatility. The indicator   automatically   adjusts to any instrument and timeframe. When the   level 80   is broken through and then tested, we   buy. When   level 20   is broken through and then tested, we   sell. The target is 00. Attention. Due to
FREE
UPD1 Impulse Channel
Vitaliy Kuznetsov
5 (6)
The channel indicator is trending and does not repaint. It creates an ATR price channel with the opposite volatility border. The indicator has proven itself well in the strategy of trading on impulse levels and fake breakout. The entry point should be looked for on the correction to the indicator line, and the take profit should be set on the opposite border. Blog-Link -   Retest and Fake Breakout with UPD1 . Input parameters. Bars Count - history to display. ATR - average true range peri
FREE
The indicator searches for impulse candles and displays them on the chart. It includes a shadow filter. It also finds breakout levels of Bollinger Bands. You can enable multi-currency dashboard in the settings. Alerting choose between the current chart or the entire list. Blog-Link -  Retest and Fake Breakout with UPD1 Trading patterns: Trend retest. False Breakout. Others. EURUSD, GBPUSD, XAUUSD, ... M15, M30, H1. Input parameters. Basic. Bars Count - the number of history bars on whic
UPD1 Fibo Levels
Vitaliy Kuznetsov
5 (1)
The indicator analyzes the specified number of candles and plots Fibonacci levels based on the high-low. Since the levels are rearranging, we are interested in the right side of the range. The price magnetizes the levels and reacts to the touch. Use this tool to find a trend entry point after a correction. If on the left we see that the levels have risen perfectly, then we can assume that we have found the end of the movement at the extreme point. All lines are drawn through buffers or objects (
FREE
UPD1 Pivot Levels
Vitaliy Kuznetsov
5 (1)
The indicator shows on the chart the classic pivot levels calculated on the basis of the previous day . You can choose from what hour to calculate the formula. Trade on reversal levels in a flat. In a trending market, use them as a target. Combine with your strategies for successful trading. The levels are drawn using   buffers and displayed on the entire available quote   history. Input parameters. Start Hour - Choose from what hour to start building levels. 00 - Default. Show Mid Pivots -
FREE
The meaning of this indicator is to   find Murray levels on all timeframes   and combine them into   combo levels , including signal levels based on strong Murray levels (+2, +1, 8, 4, 0, -1, -2). The lower the timeframe, the more chances you have to see the combo level immediately. It will be highlighted in color. When you hover over any number, a hint will pop up to which timeframe the level belongs to. But you will always see the current timeframe as the leftmost one. A  smart alert  will hel
The indicator searches for and displays large shadows on the chart automatically based on volatility. Shadows are additionally filtered by the wave size. The algorithm analyzes the fractal breakdown by the shadow in the specified range and displays the level. In the settings, you can enable a multi-currency dashboard. The alert is selected between the current schedule or the entire dashboard sheet. Signals for large shadows and those that have broken through the fractal level can be turned on s
The indicator builds a three-period semaphore and reversal pattern 123 from the extremum. The signal comes at the opening of the second candle. This pattern can be traded in different ways (test point 3, breakout and others). Exit from the channel or breakout of the trendline is the main trigger for finding an entry point. Icons are colored according to Fibonacci levels. Yellow icons indicate a test of a level at which the signal is amplified. Using the multi-currency dashboard, you can track w
UPD1 Profile Levels MT5
Vitaliy Kuznetsov
5 (3)
The indicator finds the levels of the maximum and minimum price volume (market profile) on the working histogram for the specified number of bars.  Composite profile . The height of the histogram is fully automatic and adapts to any instrument and timeframe. The author's algorithm is used and does not repeat well-known analogues. The height of the two histograms is approximately equal to the average height of the candle. Smart alert will help you to inform about the price concerning the volume l
Filter:
Frank Paetsch
7067
Frank Paetsch 2024.03.20 10:27 
 

User didn't leave any comment to the rating

Vitaliy Kuznetsov
33430
Reply from developer Vitaliy Kuznetsov 2024.03.20 18:52
Thank you for your high rating
Reply to review