Support and Resistance Levels on AZZD and EF
- Indicators
- Sergey Efimenko
- Version: 1.2
- Updated: 19 August 2021
- Activations: 10
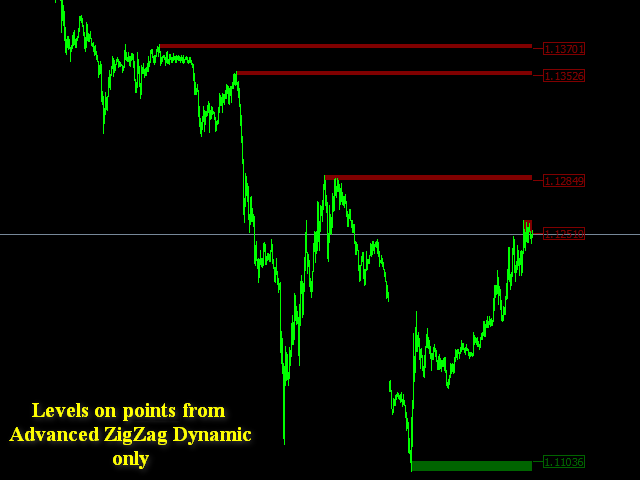
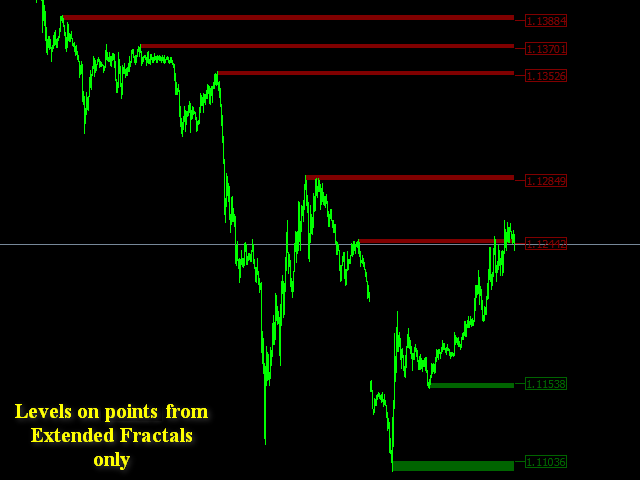
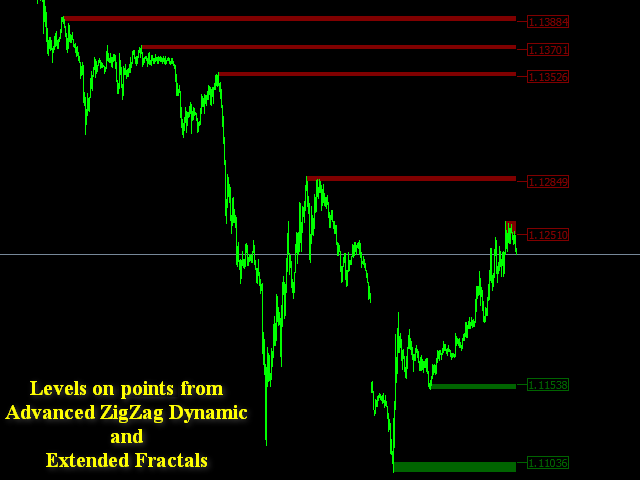
This is an MTF indicator of support and resistance levels based on Advanced ZigZag Dynamic and/or Extended Fractals indicator extremums with price labels (can be disabled). More higher TFs can be selected for MTF mode. By default, the levels are generated based on ZigZag indicator dots. Fractals indicator dots can also be used together with ZigZag or instead of it. In order to simplify the use and save CPU time, calculation is performed once per each bar at its opening.
Parameters:- ForcedTF - chart timeframe for level calculation (may be equal to the current one or exceed it)
- MinPipsLevelWidth - minimum level width in points (used for very tight levels)
- Use ZigZag Extremums points - enable/disable using ZigZag peaks to calculate support/resistance levels
- Fixed pips range - distance between the minimum and the maximum for calculating ZigZag indicator
- UseDynamicRange - enable/disable dynamic calculation of the distance between the minimum and the maximum for ZigZag indicator
- Dynamic volatility period - volatility period for calculating the dynamic distance between the minimum and the maximum for ZigZag indicator
- Dynamic volatility coefficient - volatility multiplier for calculating the dynamic distance between the minimum and the maximum for ZigZag indicator
- Use Fractals points - enable/disable using Fractals to calculate support/resistance levels
- Left fractal bars count - number of bars from one side for searching Fractals (excluding the central one)
- UseNarrowBands - enable/disable "wider" levels (calculation is performed by max and min price values of bar opening/closing)
- KillRetouch - enable/disable creating a new level if it is formed inside the existing one
- TopColor - resistance level color
- BotColor - support level color
- ShowLevelsPriceLabels - enable/disable level price labels
- PriceLabelWidth - size of a level price label
- TouchAlert - enable/disable alert when level is touched
- BreakAlert - enable/disable alert at level breakdown
- BreakOnClose - consider a breakout only after the bar closes behind the level (false - the current bar's price enters the level)
- EnableAlertMesage - enable/disable text message
- EnableAlertNotification - enable/disable notification
- EnableAlertMail - enable/disable e-mail messages
- EnableAlertSound - enable/disable sound alert
- AlertSoundFileName - sound alert file name


Good Author and useful tools, 5 stars!