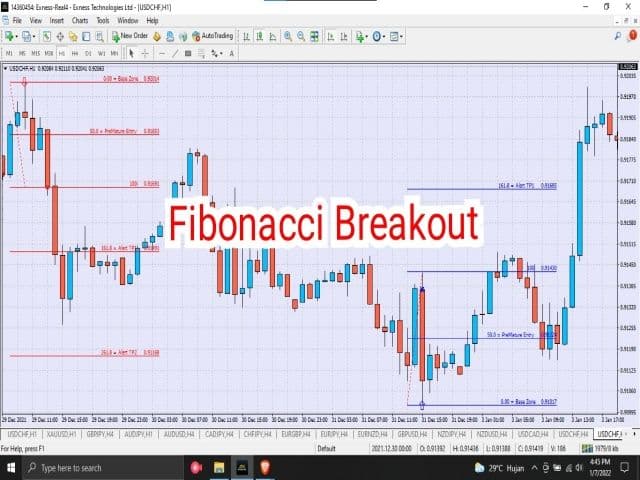
Fibonacci Breakout
- Indicators
- Agus Putu Gede Wira Adnyana
- Version: 1.0
- Activations: 5
Fibonacci Breakout is a trading strategy using the Fibonacci retracement. This technique is actually a technique to allow us to enter the beginning of the trend. Its very easy to understand even for beginner.
The strategy is that you just have to wait for the automatic custom fibonacci appear then manually place your pending order, stop loss and take profit at the level of Fibonacci. The position will be opened when the price make a successful retest. Fibonacci Breakout Suitable for Forex, Crypto and stocks.
Fibonacci Breakout Level details :
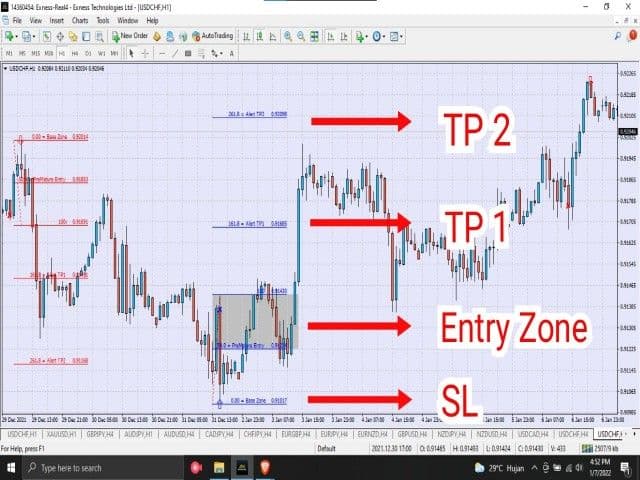
1- Monitor Trade = 0 (can be a stop loss level)
2- Entry Zones = 0.50 – 1.00 (Entry when The price Inside The Zone)
3- Take Profit Zones
- TP 1 = 1.618
- TP 2 = 2.618
- TP 3 = 4.236
STANDARD OPERATING PROCEDURE (SOP)
• The SOP is very simple and easy to understand. System will identify the presence of:
- Initial Break (IB) or Dominant Break (DB)
- Candle Break 1 (CB1) - marked with blue or red color of X symbol (Actually B point of previous ABC pattern)
- Retest (Fibonacci level 0.50 – 1.00)
• When the 3 conditions are met, the SOP is complete. Fibonacci will appear on chart to give entry zone (EZ), take profit (TP) level and stoploss level (SL).
• The probability of a successful trade is in the high percentile ( >80% ) if this simple rule is followed SOP & Money Management.
• Never trade against the trend of the market. Always wait for SOP.
• As long as no CS closed above the Monitor Trade level the SOP is valid.
• Recommend timeframe 1H & 4H for Intraday. If you like scalping you can use Timeframe 5M.
SIMPLE TIPS ;
- For consisten profit always take profit at TP 1 level.
- On the chart, look to the left, if the price hit TP 2 or TP 3 usually its completed trend cycle (time to reverse) so also can be entry point at this zones.
- Always check the trend with auto fibonacci on higher time frames .
The indicator can help you find the best opportunities in the market with a risk and reward of up to 1:4. this will give you accumulated profit at the end of the month.
you just need to be disciplined with your trading plan and money management. trading is a high risk business. All risks are your responsibility as a professional trader.


I purchased the indicator because I am always looking for something that may help with Fibonacci. There is not much direction on how the indicator works other than a few pictures. The Vendor says he has no instructional videos at the moment. I say this because the inputs are not your general inputs, but have many options to consider. (which I appreciate but am even more confused) I will have to come back at a later time to update. Right now I have it on the AudJpy 5M chart and not sure what it is doing. I have an red X that turned to a green X. Still hoping for a video with instructions. One of the other concerns is the indicator does not display the 38.2 nor the 61.8. It does have the 50 and the 78.6. Thank you.