Volume MT4 Indicator by PipTick
- Indicators
- Michal Jurnik
- Version: 1.4
- Updated: 3 December 2021
- Activations: 5
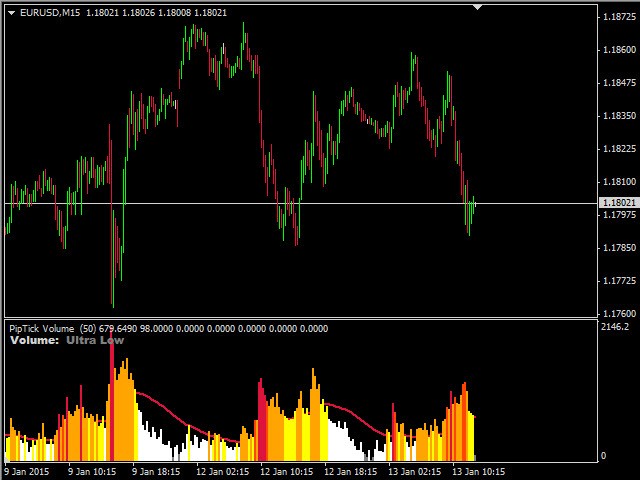
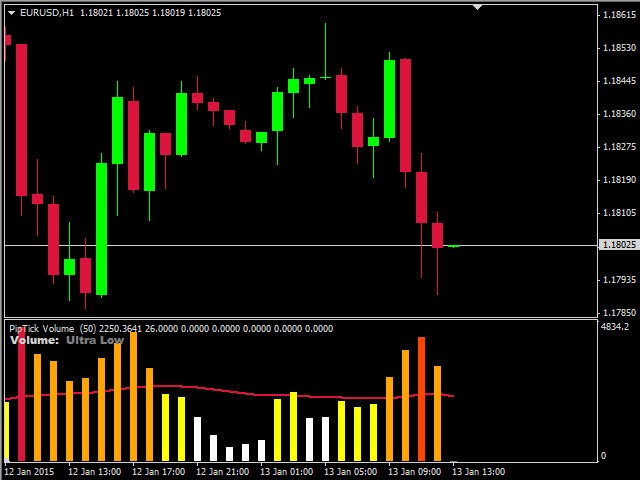
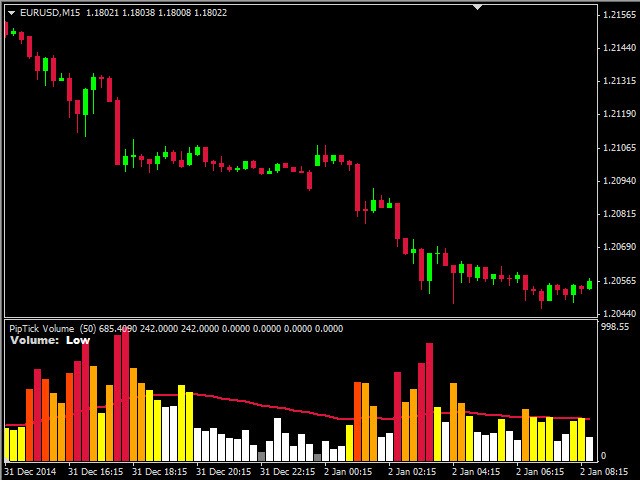
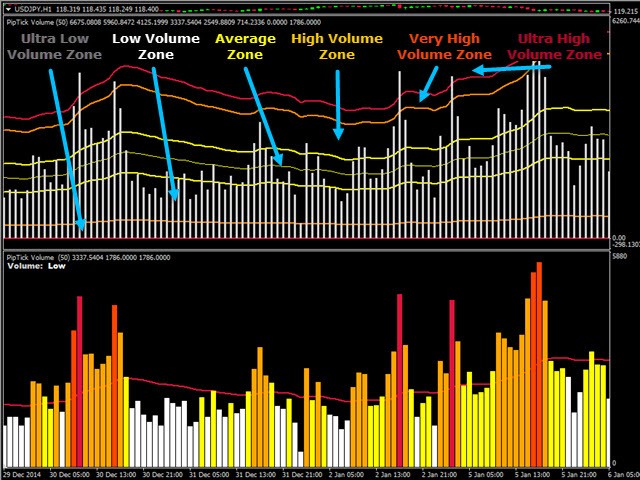
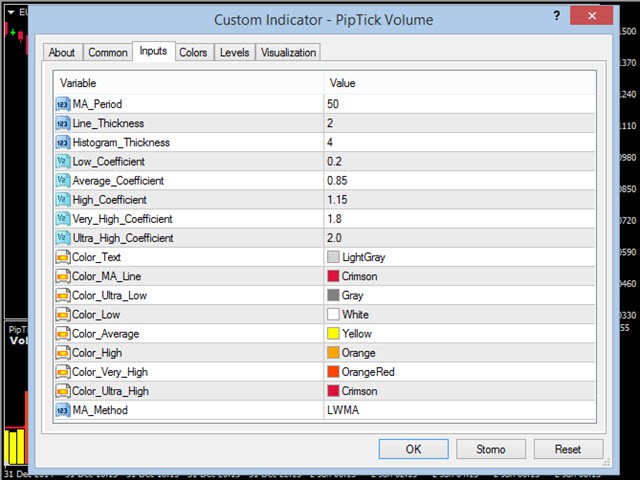
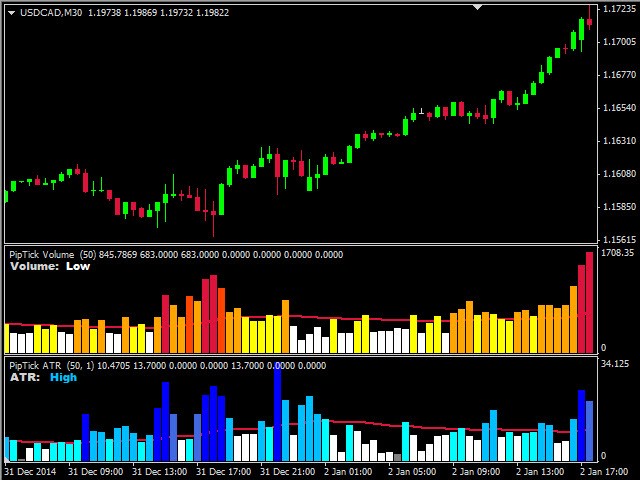
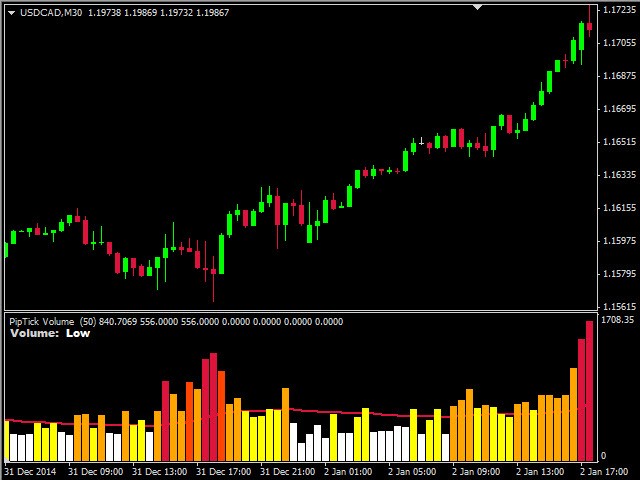
The Volume indicator is an excellent tool for measuring tick volume or real volume activity. It quickly and easily helps traders evaluate the volume's current size. The indicator for classification of the volume size uses the moving average and its multiples. Accordingly, the area where the volume is located (relative to the moving average) is labeled as ultra-low, low, average, high, very high, or ultra-high.
This indicator can calculate the moving average by four methods:
- SMA - Simple Moving Average
- SMMA - Smoothed Moving Average
- EMA - Exponential Moving Average
- LWMA - Linear Weighted Moving Average
Interpretation
By default, there are six zones that a user can change. Depending on which zone corresponds to the volume, the histogram bar is colored with an appropriate color. This way, you can easily recognize how high the volume is compared to previous bars.
- Ultra Low volume zone - gray
- Low volume zone - white
- Average volume zone - yellow
- High volume zone - gold
- Very High volume zone - dark orange
- Ultra High volume zone - crimson
Main Features
- A simple classification of volume.
- Several optional calculation methods.
- User selectable ranges of the zones.
- Works on every timeframe (M1, M5, M15, M30, H1, H4, D1, W1, and MN).
- A very fast and reliable indicator.
- Customizable parameters (colors, line thickness, MA period, etc.).
- Real and Tick Volume.


User didn't leave any comment to the rating