Maximum Directional Index
- Indicators
- Elias Mtwenge
- Version: 1.0
- Activations: 20
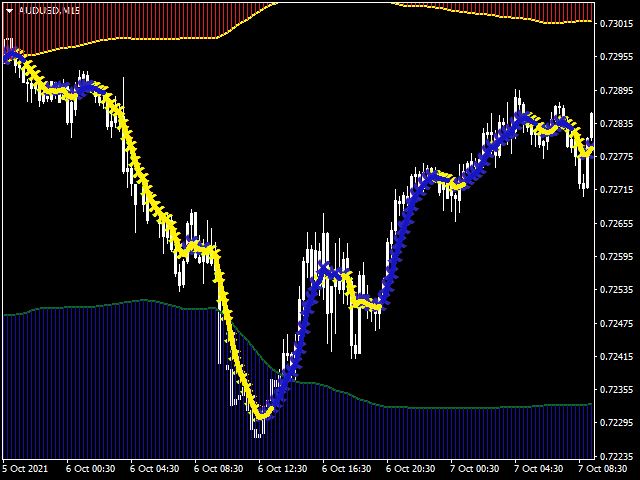
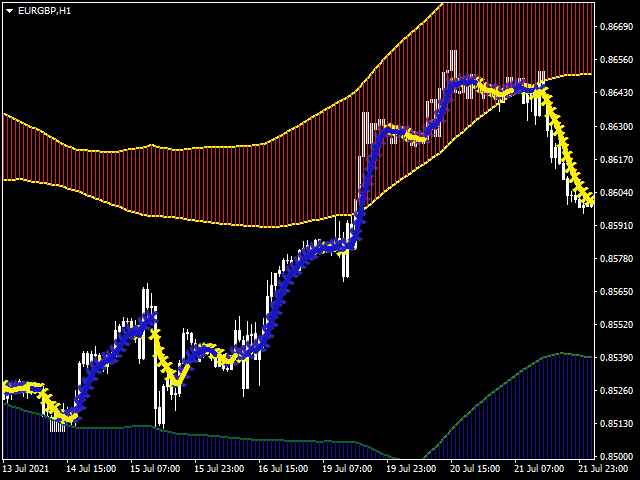
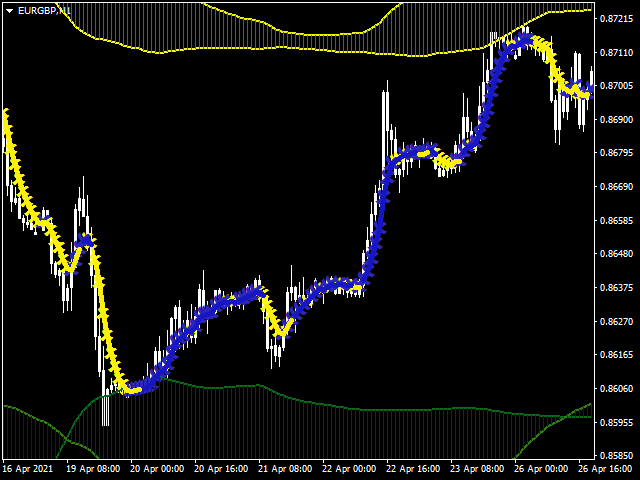
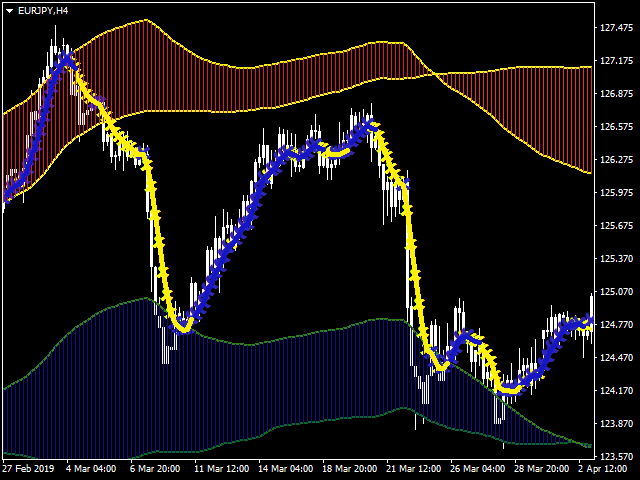
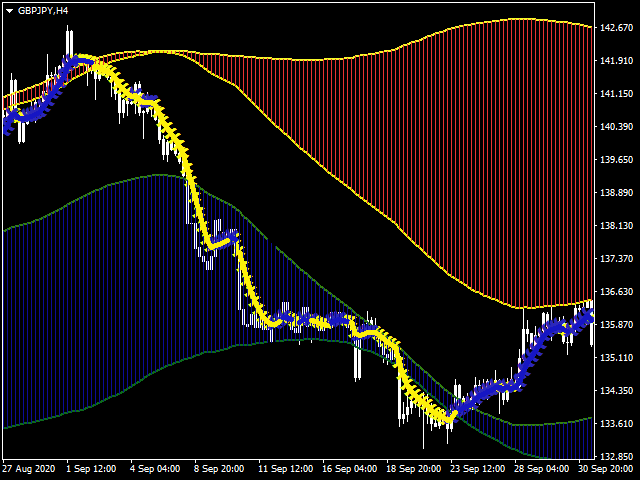
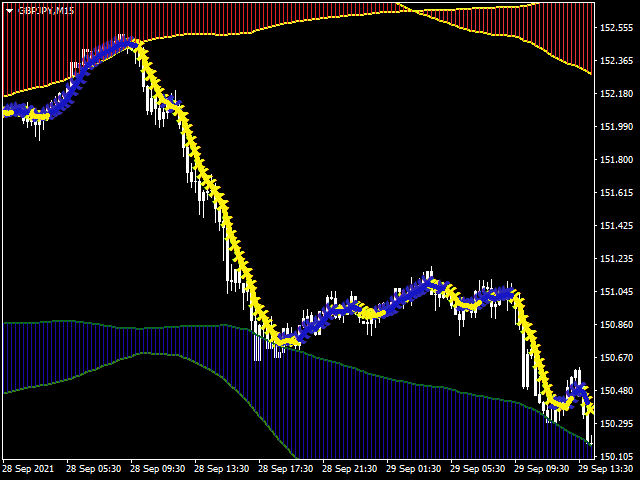
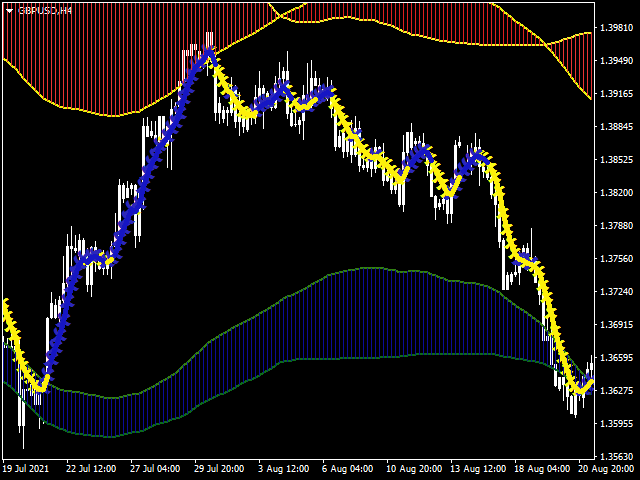
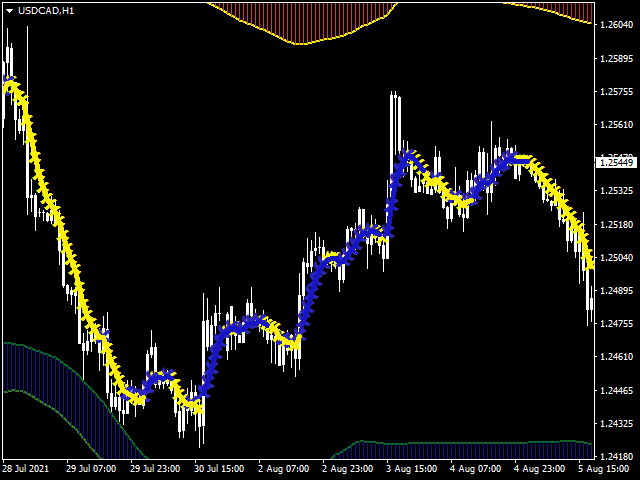
Maximum Directional Index (MDI) is designed for two purposes.
1. To show the direction of the trend (The blue yellow trend line)
2. To show the Overbought (Resistance) and Oversold (Support) zones for a trader to know whether the trend is about to reverse or not. It shows the maximum direction of the price trend.
How it works
1. The indicator works on all time-frames but for clarity I recommend you use it on 5minutes, 15miutes, 30minutes, 1 hour and 4 hours time-frame charts.
2. The indicator can be used on any pair but ranging pairs will generate more signals. While for the trending pairs should wait and wait for the price to go deep in the particular zone.
3. The indicator has a red histogram clouds (for overbought zones/resistance zone) and the blue histogram clouds for oversold zone/support zone)
4. We look for sell opportunities when price is trading near/inside the red cloud and the trend line has turned yellowish pointing downward.
5. We look for buy opportunities when price is trading near/inside the blue cloud and the trend line has turned blue pointing upward.
6. It can be used on all markets.
7. The indicator do not repaint.
Last words.
Disclaimer: You should not consider this product's signal as the final in making financial decisions. You may lose your valuable capital if not making wise decisions. Your are responsible for every action you take.
Thank you for considering my product.

