Volume Zone Fractal
- Indicators
- Eduardo Da Costa Custodio Santos
- Version: 1.0
- Activations: 20
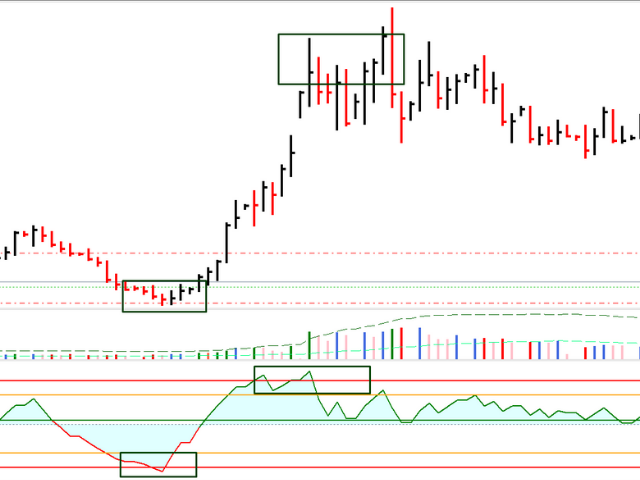
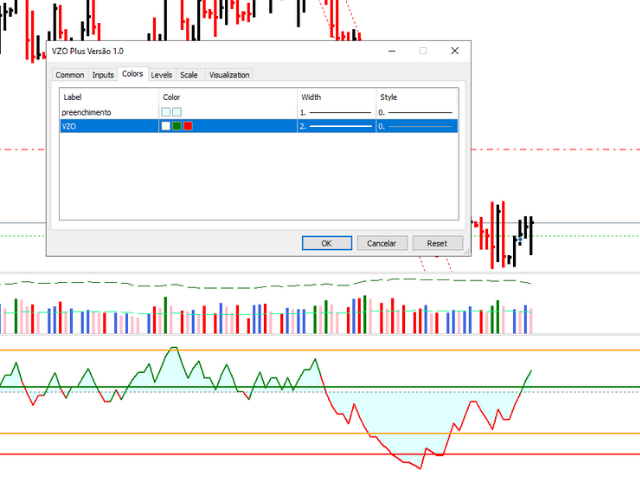
VZO Plus is an indicator that shows overbought and oversold regions based on traded volume.
#When the indicator line is between -40 and -60 it is oversold
#When the indicator line is between 40 and 60 it is overbought.
Outside these regions, the market is following its natural path by inertia.
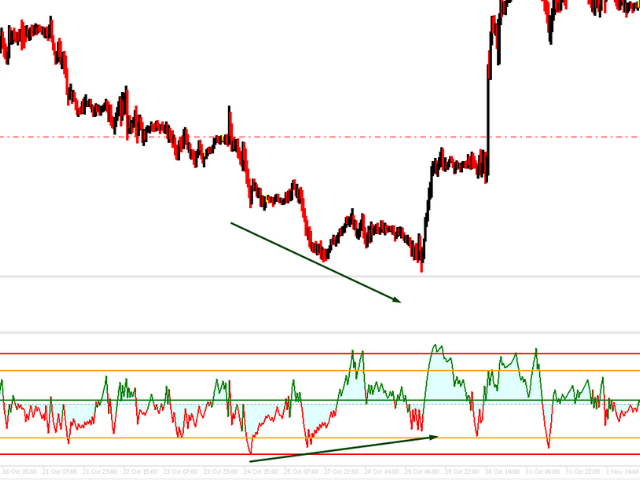
Above the green line, it means that the market is positive, Another way to analyze the indicator is through divergence regions.
When we have the bottom higher than the other in a downtrend or One bottom is smaller than the other in an uptrend


