
Ticks
- Indicators
- Andrej Nikitin
- Version: 1.14
- Updated: 8 February 2024
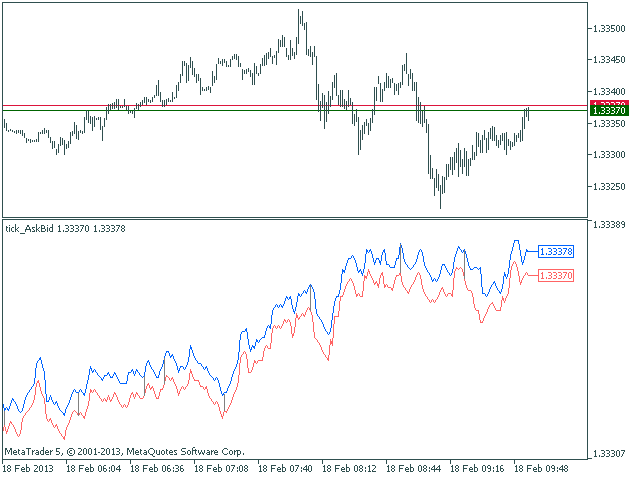
A simple tick indicator of Bid and Ask prices. The period separator (1 minute) is displayed as a histogram.
Parameters
- Show Bid Line - show/hide the Bid line;
- Show Ask Line - show/hide the Ask line;
- Show Labels - show/hide the last price values.


User didn't leave any comment to the rating