MarketMonitor
- Indicators
- Vasyl Temchenko
- Version: 1.0
- Activations: 5
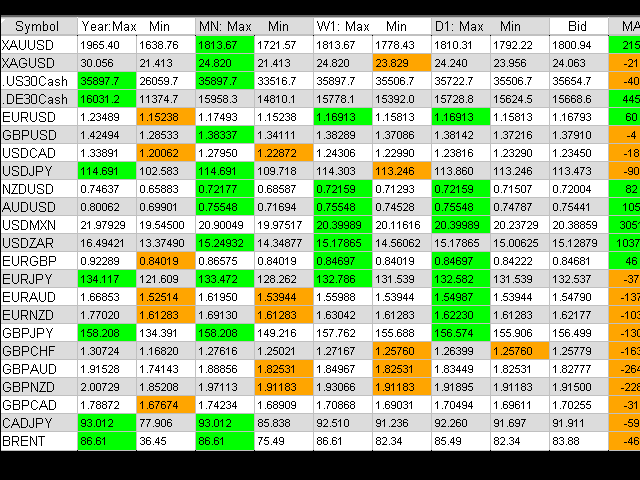
The application displays data from several dozen pairs on one sheet. This allows you to quickly identify promising pairs for trading.
There is no need to open and analyze dozens of charts, you will only open 3-4-5 charts and exactly the ones that need to be analyzed.
See in "Comments" full size picture.
The menu can be set from 1 to 30 symbols. If this is not enough, then you can add an unlimited number through the graphical interface. You can also delete unnecessary pairs there.
The GUI also allows you to change the trend settings of the built-in indicators.
The indicator finds the maximum and minimum of day, week, month, year. The table displays the maximum / minimum values. The "maximum-minimum" amplitude is displayed in the tooltip for each of the periods.
If the price approached the maximum or minimum, then the corresponding cell changes color. If the maximum is Lime, if the minimum is Orange.
The high / low can also be compared with the current price, which is also displayed in the table.
There are 3 indicators built into the application: MA-Cross, MACD, RSI.
The table displays the current values of the indicators, and also the trend direction is indicated by color.
The basic settings of the indicators are set in the menu, all of them can be changed through the GUI.
Double-clicking the thick green line below the GUI opens the application menu.
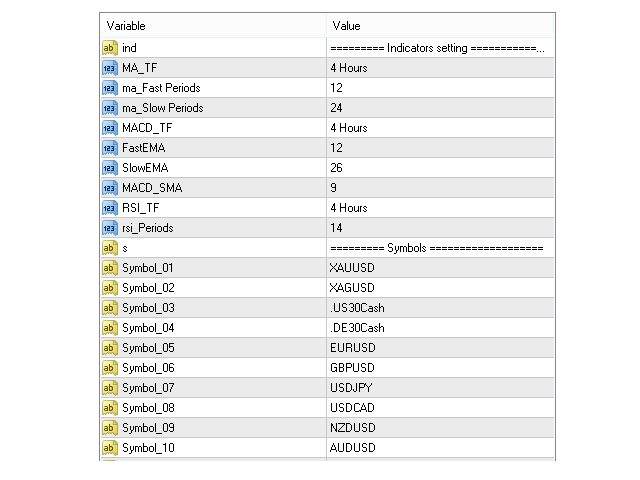
Input parameters
- MA_TF ... ... ... rsi_Periods - Indicators input parameters.
- Symbol_01 ... Symbol_30 are the names of the pairs that you intend to observe. The names must be entered exactly as they appear on the Market Watch tab. Case, dots, dashes matter.