QRSI Calc Auto MT5
- Indicators
- Tatiana Savkevych
- Version: 1.0
- Activations: 5
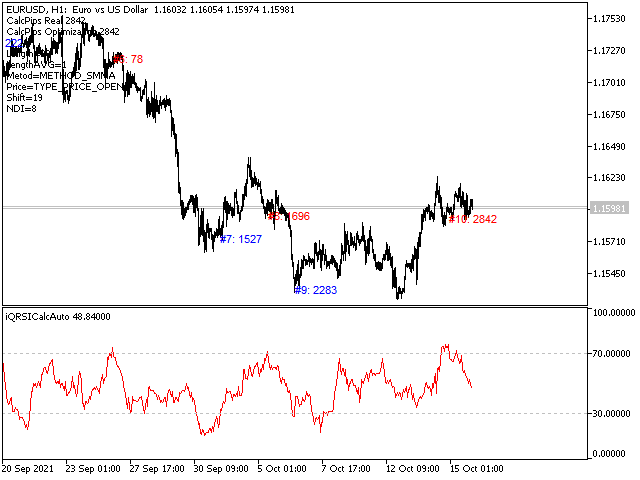
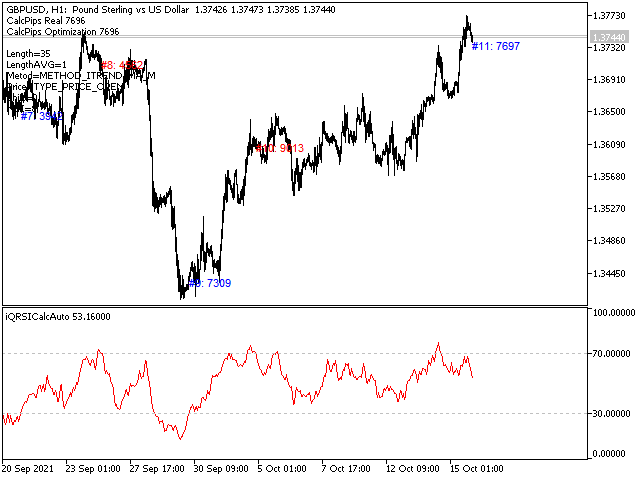
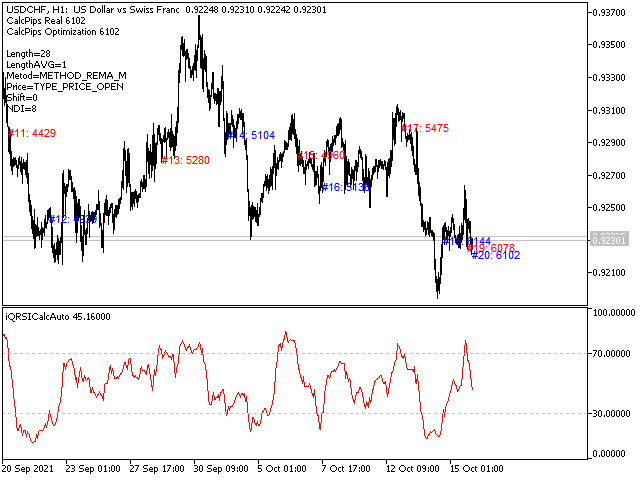
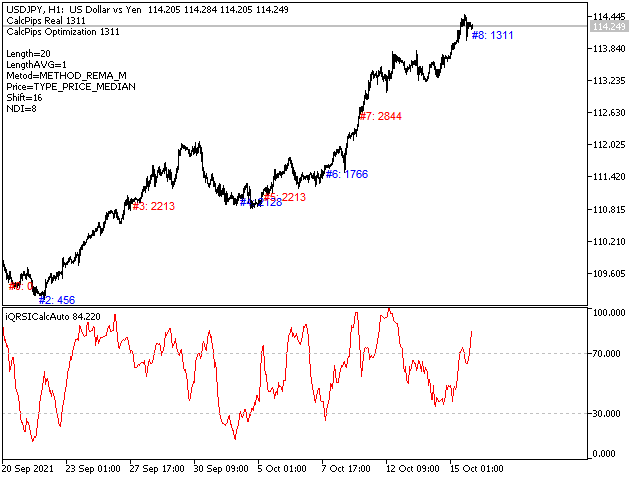
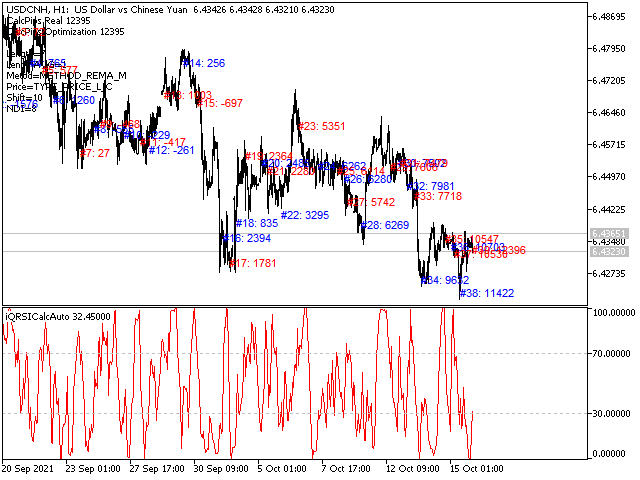
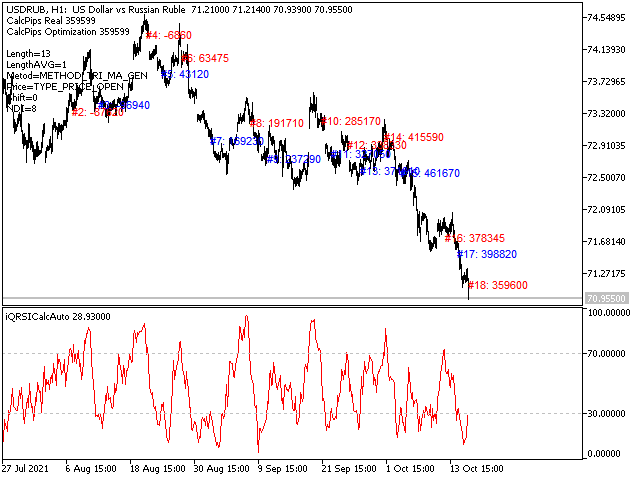
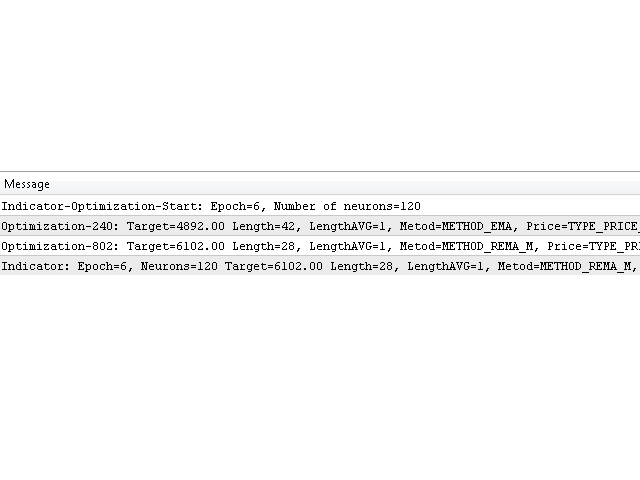
The QRSI indicator is one of the most important and well-known indicators used by traders around the world. It is also obvious that this indicator is capable of showing good entries in every local area. For which it usually needs to be optimized or just visually adjusted. This development is intended for automatic optimization of the indicator. Once placed on the chart, the indicator will automatically re-optimize itself with the specified period (PeriodReOptimization) and display the chart with already changed (optimal) parameters. Also, the optimal parameters and the profit they give in a given section of history will be reflected in the form of comments on the chart.
All signals are generated at the opening of the bar. Any closing price or zero bar prices are replaced with the corresponding price of the previous bar in order to avoid false results. This indicator is suitable for those who are interested in the classic calculation method but with improved functionality. There is a version for both MT4 and MT5.
In general, about the basic indicator.
By its nature, the QRSI indicator is an oscillator, that is, it fluctuates in a certain zone, limited by the maximum (100) and minimum (0) values. Specifically, this indicator works according to an accelerated algorithm, but this is not its only difference. This indicator implements a more advanced calculation based on the Relative Strength Index algorithm. The peculiarity of the implementation is that improved functionality is used for the calculation. This indicator is suitable for those who are interested in the classic calculation method but with improved functionality.
Information about the advanced functionality of the indicator itself.
This version of the indicator differs in that it has an extended functionality for calculating the averaging Metod (below is a list), as well as advanced possibilities for calculating the application to prices Price (below is a list). A significant drawback has also been removed, namely the inability to see the digital display of the inputs. And in this implementation, we can see not only the projection of the calculations on the chart in the form of a curve, but also a digital view - how well this curve will work itself out if trading on it according to the specified rules. The Rules parameter (the list below is presented) sets the rules for trading by the indicator, of course, here it is necessary to take into account that trading by the indicator is, first of all, strict adherence to the rules.
Enumeration reference will be provided in the first discussion post.

