The Trend Monster
- Indicators
- Elias Mtwenge
- Version: 1.0
- Activations: 20
The Trend Monster is a trend following non repainting indicator based on moving averages.
As traders we want to be careful not to trade against the trend.
Therefore when you look at the chart as a trader you will have to ask yourself these kind of questions
- Is this market trending?
- Is this market ranging/trading sideways?
- Is this market bullish or bearish?
- What should I look for before I take a trade?
Those are some critical questions that every trader should ask him/herself before taking any trade.
The challenge faced by Most traders is that they lack enough knowledge about the market and tools to help them analyse the chart carefully. Some traders over complicate by placing hundreds of indicators on the chart to know where is the price going to go next.
This indicator is meant to do two things and these are to show you the direction of the trend plus when and where the market trend is about to reverse or end.
How it works
It is just simple. The indicator works best on H4, Daily, Weekly and Monthly timeframes.
This indicator works in all markets such as Forex, stocks and cryptos.
Using this indicator for shorter time-frames other than those mentioned above will not be as effective as it should.
The indicator is meant to work best on those time-frames recommended for professional and institutional traders
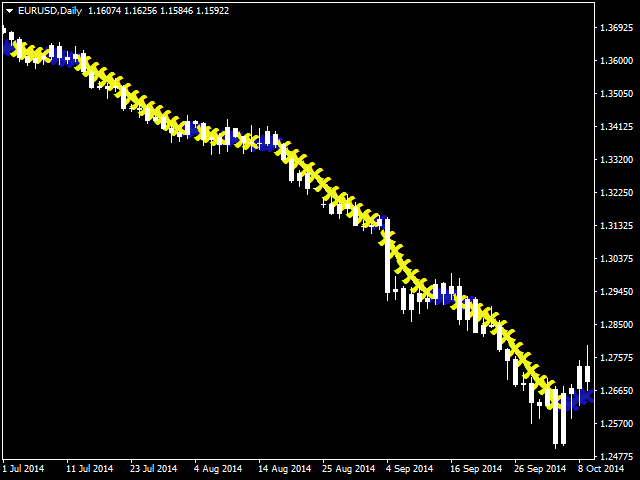
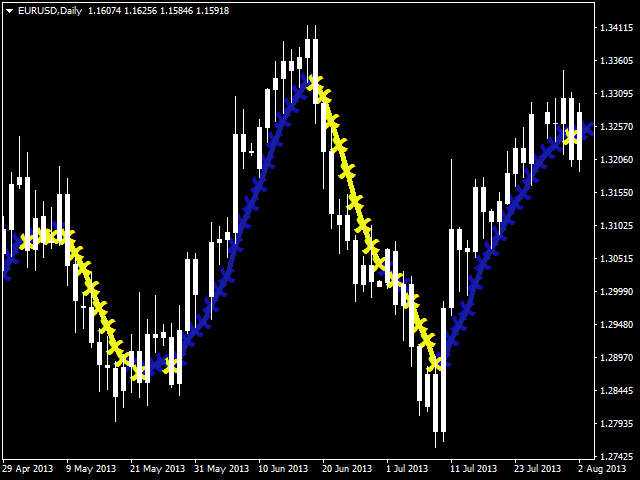
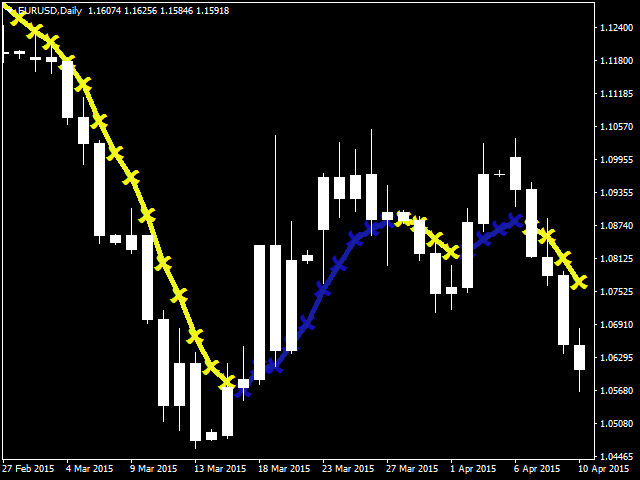
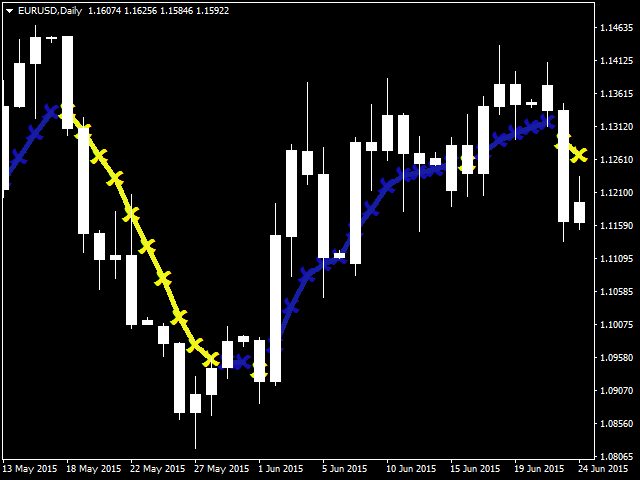
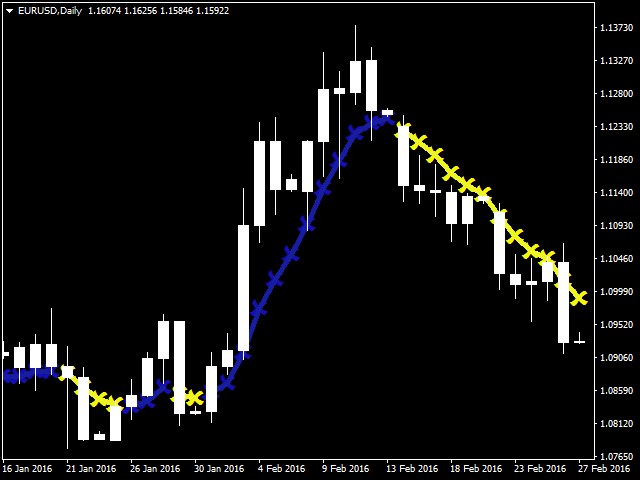
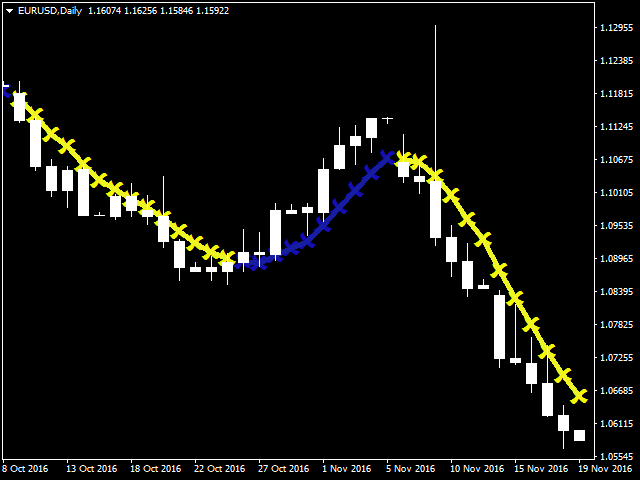
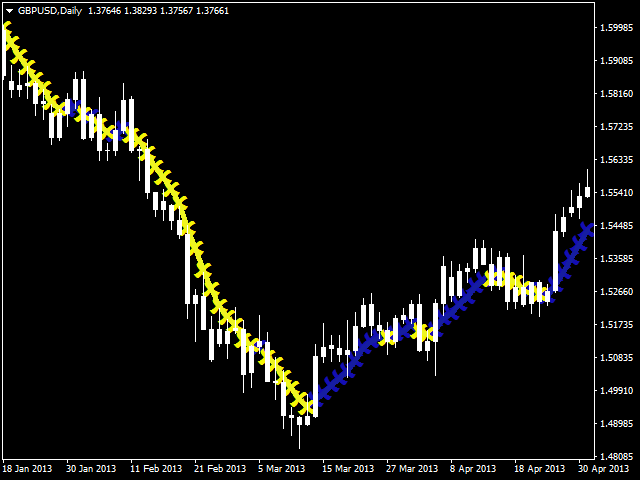
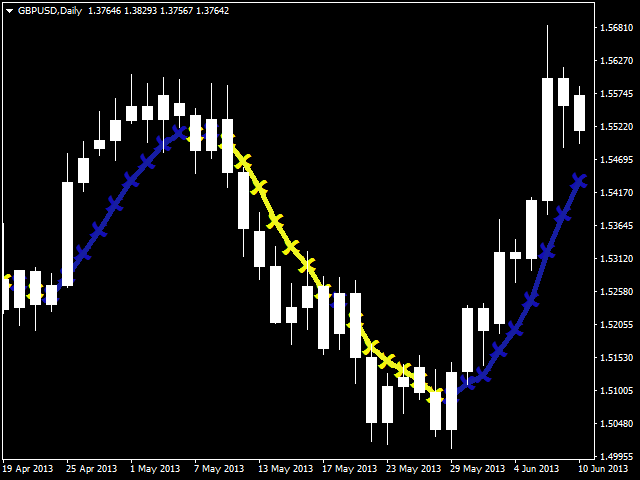
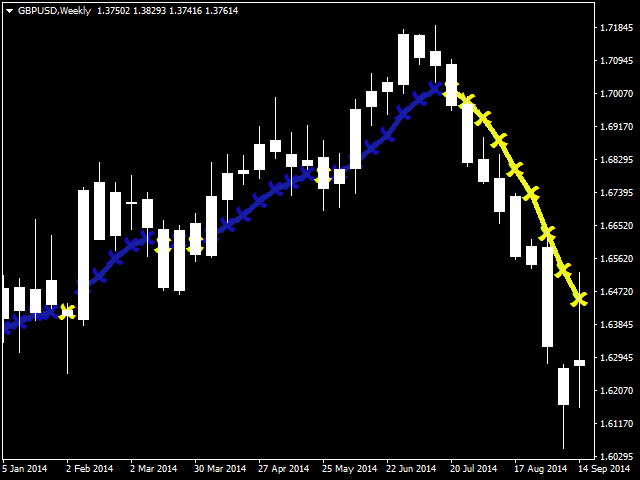
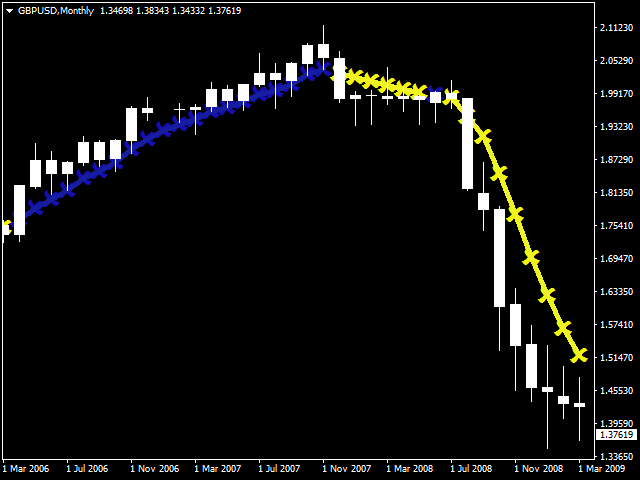
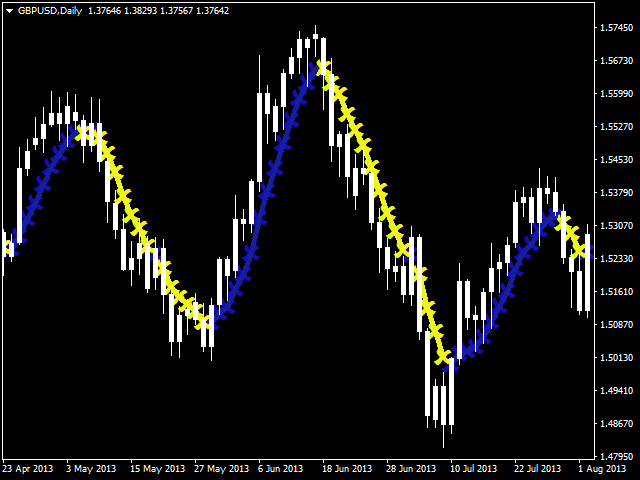
A bullish trend will be represented by a blue line and the bearish trend will be represented by a yellow line as shown on the screenshots.
You may consider price action analysis as well (demand and supply levels) for making best trade decisions.
Last words
Disclaimer: Not every signal will be correct! Signals generated by this tool should not be considered as the final to making financial decisions. You may lose your valuable capital if not making wise decisions! You are responsible for your trading decisions and actions! Thank you for working with my tools wisely.