UniversalMA MT5
- Indicators
- Mikhail Sergeev
- Version: 1.5
- Updated: 12 March 2024
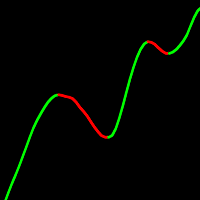
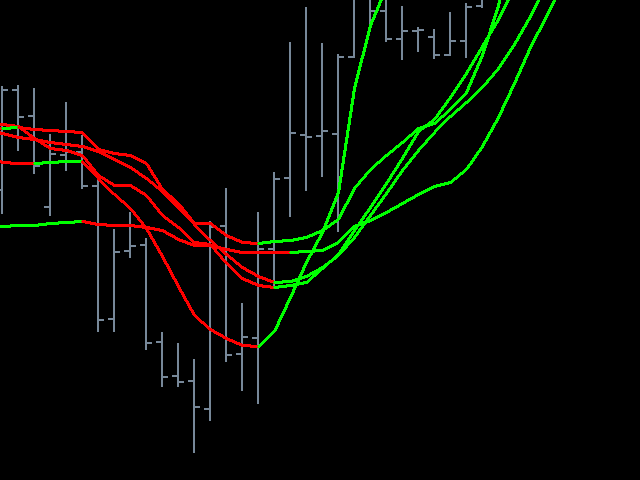
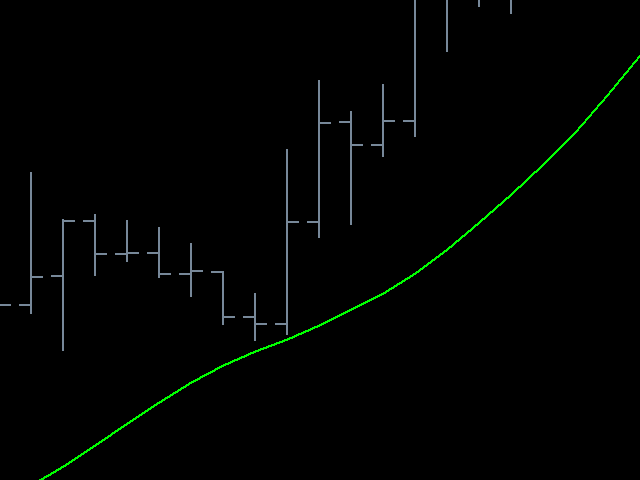
A moving average with huge customization options. 10 types of smoothing. 12 price options to build. The possibility of discretization of the resulting moving. Quick code. The ability to use in experts without restrictions. The UniversalMA indicator combines the most popular construction methods used in modern trading. Thus, it is no longer necessary to have many different indicators.
Indicator Based Expert Advisor
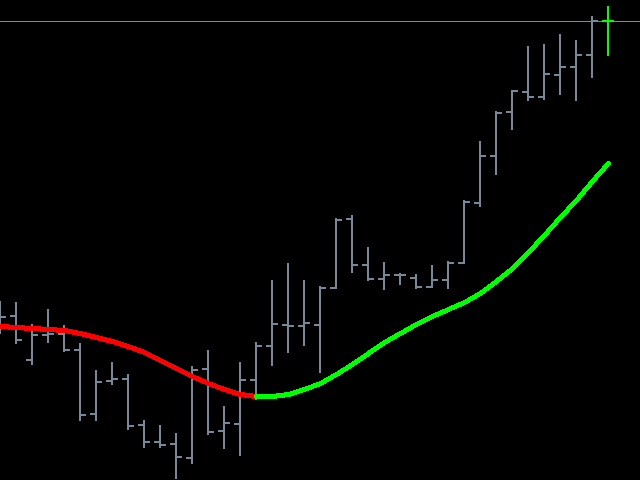
Moving averages are price-based lagging indicators that display the average price of an instrument over a set period of time. Essentially, moving averages smooth out the "noise" when trying to interpret charts. A moving average is a good way to assess momentum, as well as confirm trends and identify support and resistance areas. There are a huge variety of ways to use moving averages. The following are examples of the most common methods of use: The direction of the moving average (The main rule of using the method is to track the general direction of the moving average: it indicates the dominant trend in the market. It is worth making deals only in the direction of this movement. Such a simple rule makes the moving average method a convenient tool for short-term forecasting), crossing the moving average with a price chart, tracking the speed of the moving average, combinations of several moving averages, using the moving average as a support or resistance level (Can be used with a time offset or a shift up or down by a percentage of volatility).
Features of period settings. The parameters of the indicators can be configured at the user's request. He can set a convenient time interval. The smaller it is, the more sensitive and accurate the moving average is in giving signals. Despite the different points of view, there is no "right" time interval. To set up the best timeframe, the user will have to experiment for some time. As a result, he will understand which period is the most optimal for him, and the most suitable for his personal strategy. The concepts of "fast" and "slow" moving averages: The shorter the period, the more sensitively and promptly the movers react to every change in quotes. Therefore, movings with small periods are called a fast moving average. Conversely, the higher the period of the moving average, the more clumsy MA is and does not react at all to any small price fluctuations. This is a slow moving average.
In the process of financial market research, we try to create universal tools on the basis of which you can easily and productively create a variety of strategies. It was decided to publish such developments on a free basis. It is difficult to overestimate the contribution of MQL to the development of modern trading and automatic exchange trading. Therefore, we are glad that we can help this resource to be more saturated with high-quality and free content.
- After the bar closes, the indicator does not change its values (does not redraw).
- It works on any tools and timeframes.
- Does not load the computer (optimized code).
- Use in your experts (Buffer number 0).
Averaging algorithms present in the UniversalMA indicator:
- Simple averaging (SMA)
- Exponential averaging (EMA)
- Smoothed averaging (SMMA)
- Linearly-weighed averaging (LWMA)
- Adaptive JMA of smoothing (JJMA)
- Ultralinear JRSX smoothings (JurX)
- Parabolic approximation (ParMA)
- Tilson's algorithm (T3)
- Variable Index Dynamic Average (VIDYA)
- Adaptive Moving Average (AMA)
Indicator Parameters:
- Mode - selection of the smoothing algorithm
- PriceM - selection of the price at which the indicator is calculated.
- Period - the number of bars to average.
- Phase - a parameter that varies within -100 ... +100, affects the quality of smoothing transients
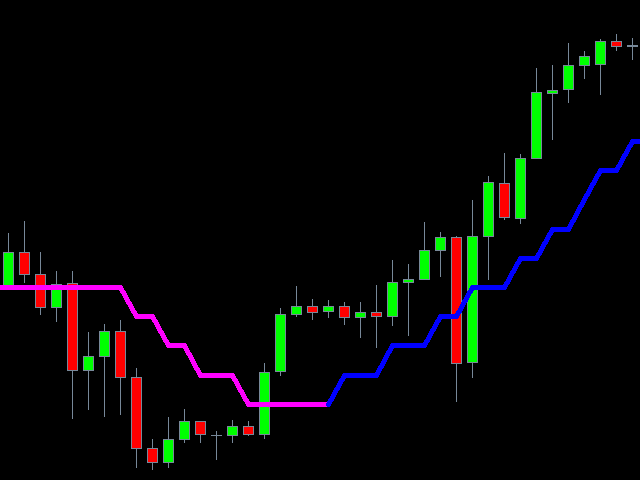
- Step - the sampling step of the moving average in points.
- Shift - the shift of the indicator along the time axis.
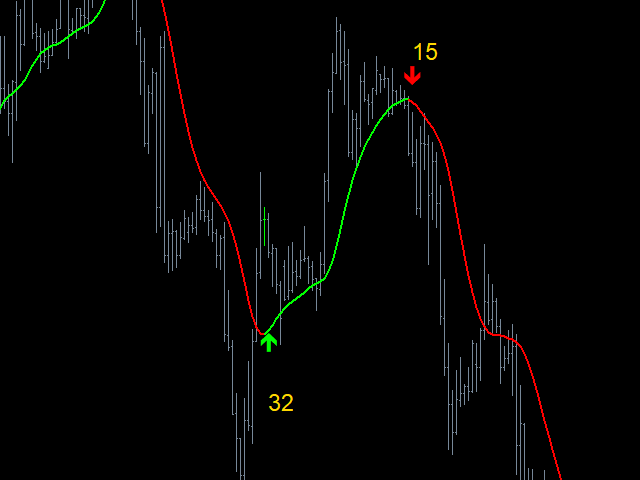
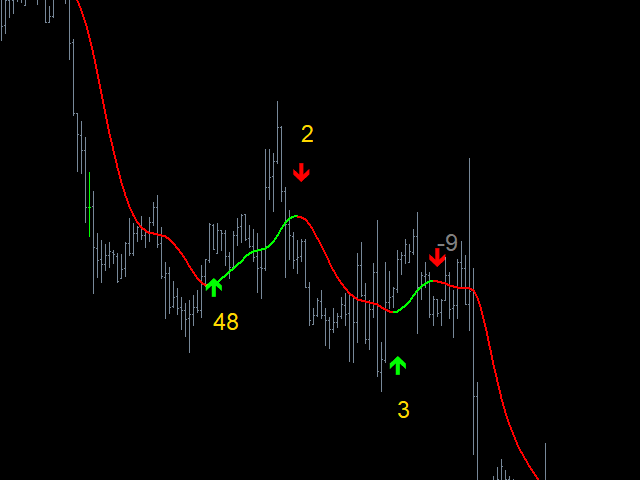
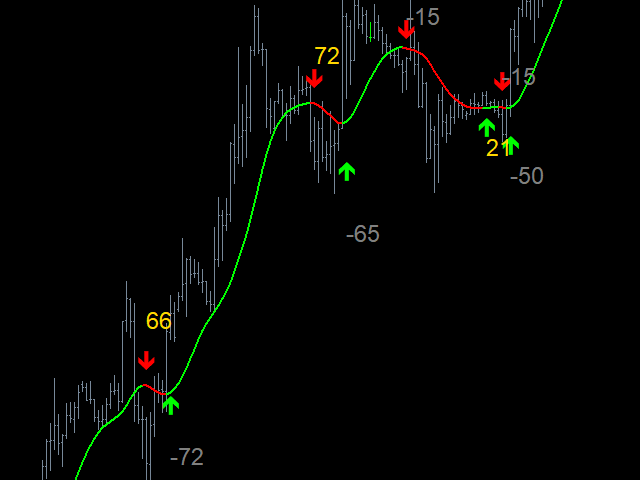
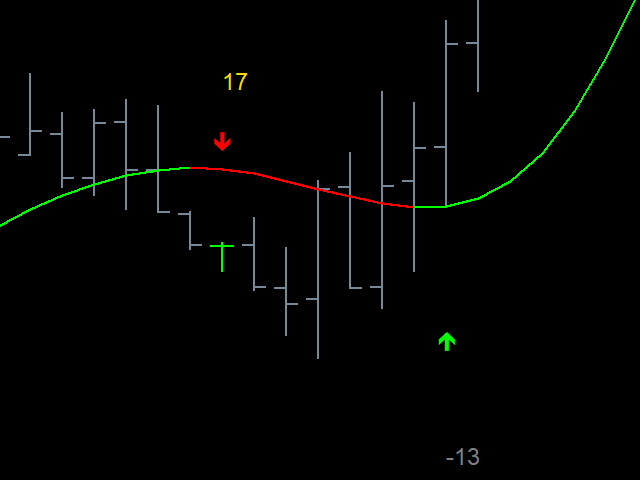
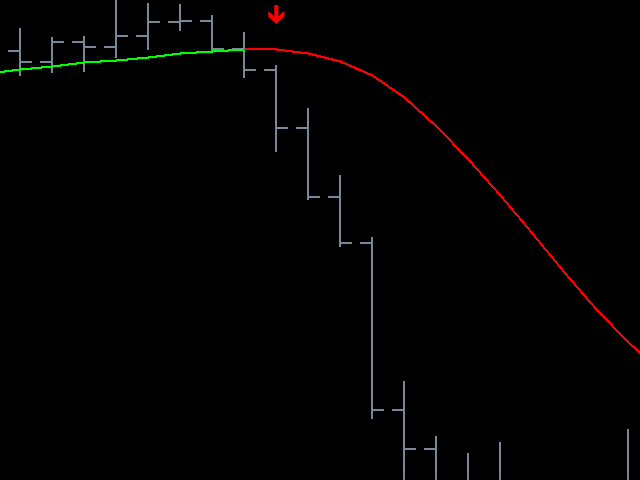
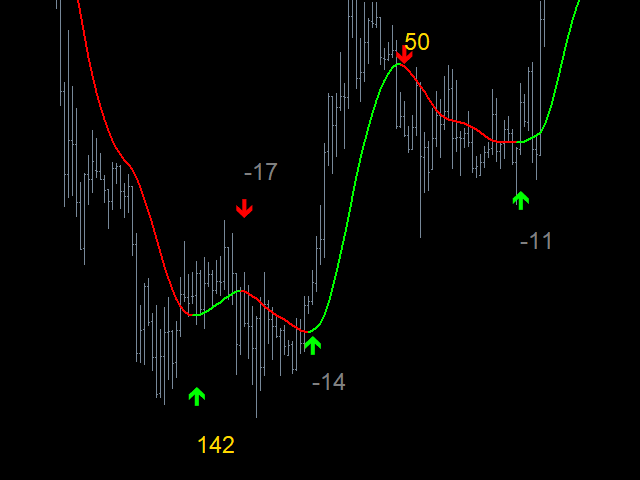
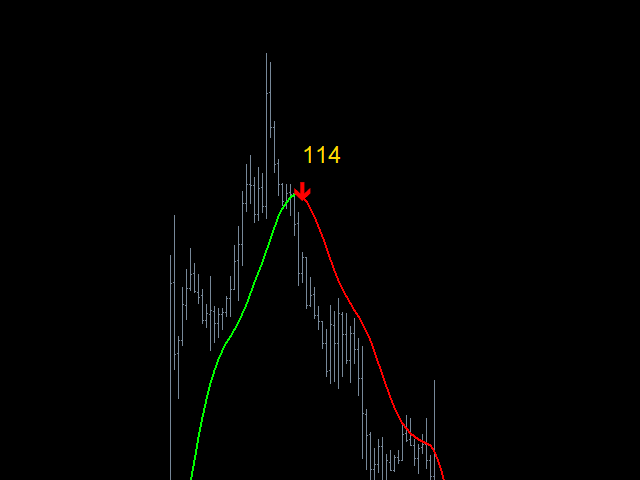
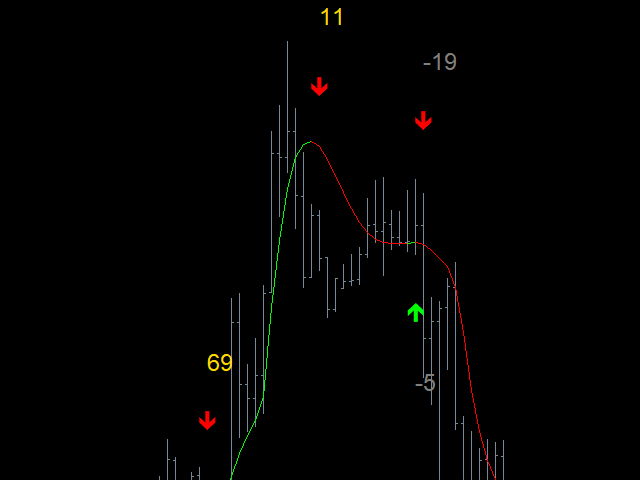
- ModePaintProfit - The indicator has a built-in function that draws arrows and displays the result of the previous trade on the indicator. This makes it very convenient to check the history. Rendering options: 0 - do not output profit, 1 - in points, 2 - price difference, 3 - in points/ 10.






Отличный индикатор