Renko Pro
- Indicators
- Kaijun Wang
- Version: 3.9
- Updated: 2 May 2023
- Activations: 5
Brick diagram-an alternative way of trading
If you are a trader who is confused by the candlesticks in countless charts, or don’t know how to draw lines or how to draw support and resistance lines, you should find another trading method that suits you at this time. NS. Just like a driver will stop for a full overhaul after repeated encounters, the same is true for a transaction.
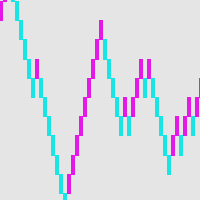
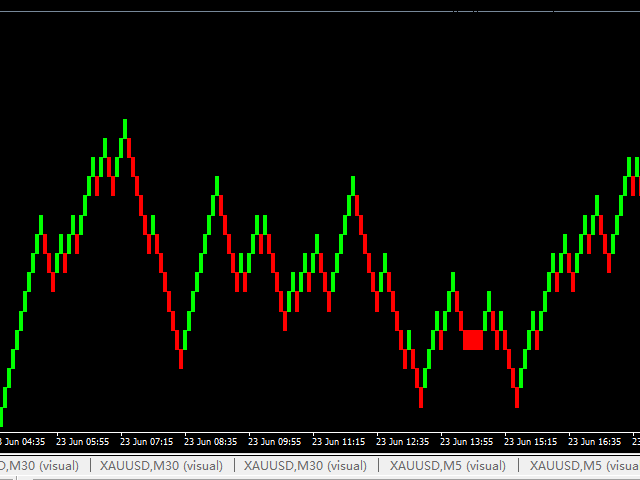
The brick chart provides a simple trading method for intraday traders. In fact, this method has the same history as K-line, and it also originated in Japan.
In order to define a brick chart, they only describe the price trend of a set point or basis point. For example, a 10-point brick chart can only depict a 10-point upward trend or a 10-point downward trend in price changes.
The brick diagram has a unique advantage that its price is not tied to time, that is to say, only when the price change reaches the set value, a new brick diagram will appear, and the brick diagram removes the price Burr, so it will feel very comfortable from the senses.


