• Overview
  • Reviews (1)
  • Comments (8)

NeuroScalperMT5

MT4 indicator version

https://www.mql5.com/en/market/product/72342


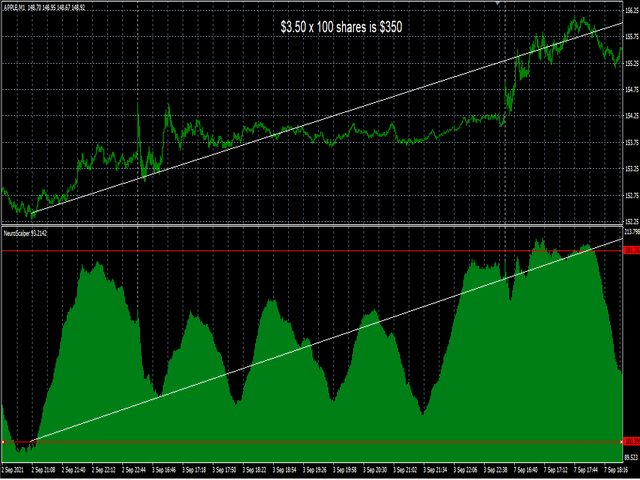
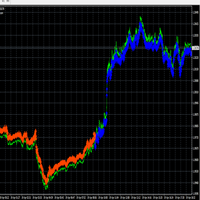
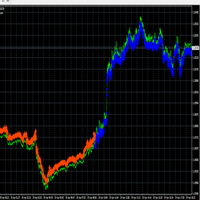
I personally use this indicator to scalp.  Accurate for accessing extremes and supports for buy positions primarily for 1 minute time frames.  Other time frames can be used but the levels are different. Its a better oscillator and compare with others to see the difference.  


Day trade using neuro network concepts.  This indicator uses elementary forms of neuro networks to generate signals to buy and sell. Use the indicator on 1 minute charts.  Indicator does not repaint.   Download and run on tester using 1 minute charts or other charts using different levels, analyze the trades to see for yourself. Many opportunities to scalp the markets.  Can be used on higher time frames but the levels should be changed according to your discretion.  Higher time frames have higher ranges.


Concept and things to consider with this model:

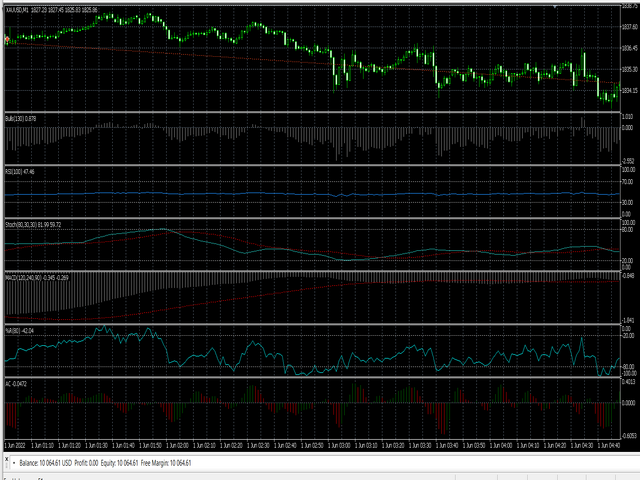
Multiple indicators are used, weights applied and 2 data points for the max an min.
This indicator is for trading uptrends mainly 
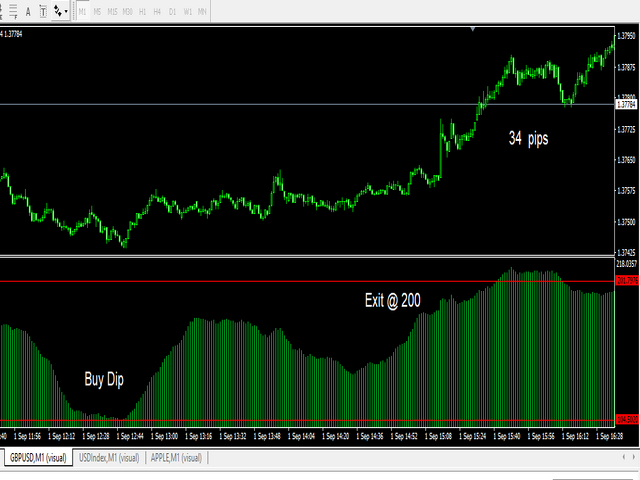
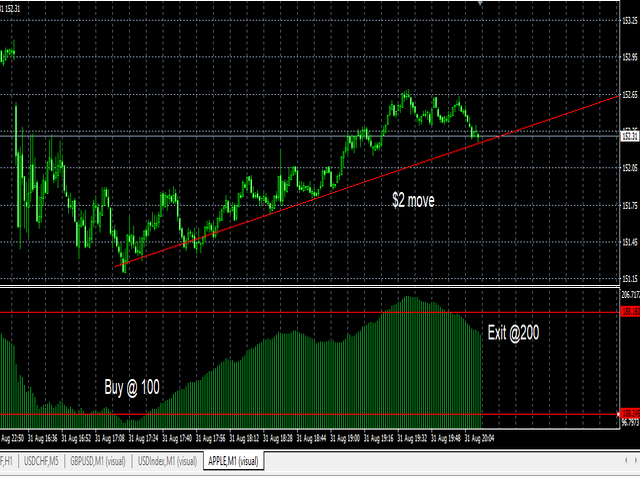
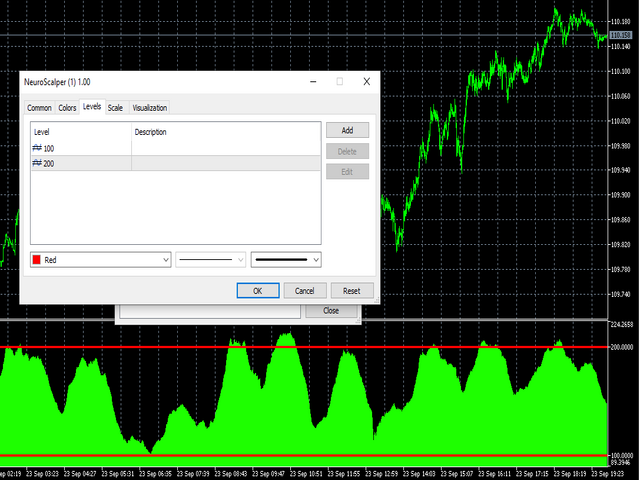
Add levels in settings(see picture) 100 and 200 for the oscillator, or other levels if using different time frames.
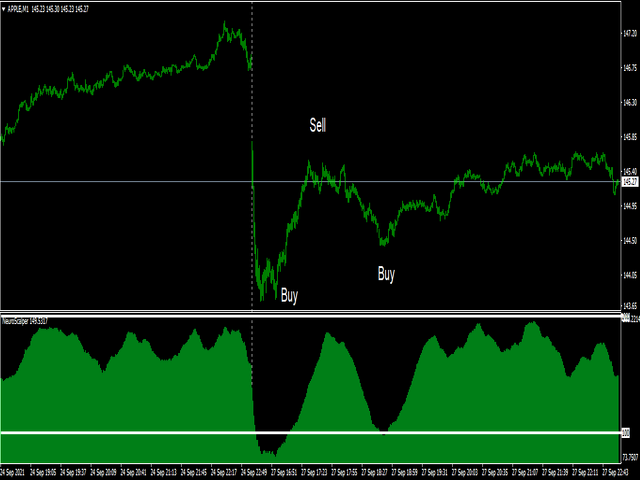
Buy when the price dips below lowest levels for the pair and time frame.  This is the cluster with good accuracy on 1 minutes.

    Rules:

    • Buy below 100 level and exit at 200.

    Download and run on tester using on the charts to see what levels are the best for buying.  Analyze the trades to see for yourself. Many opportunities to scalp the markets.


    Recommended products
    Rainbow MT5
    Jamal El Alama
    4 (1)
    Description : Rainbow MT5 is a technical indicator based on Moving Average with period 34 and very easy to use. When price crosses above MA and MA changes color to green, then this is a signal to buy. When price crosses below MA and MA changes color to red, then this is a signal to sell. The Expert advisor ( Rainbow EA MT5 ) based on Rainbow MT5 indicator is now available here . MT4 version is available here .
    FREE
    Follow The Line MT5
    Oliver Gideon Amofa Appiah
    4.52 (29)
    This indicator obeys the popular maxim that: "THE TREND IS YOUR FRIEND" It paints a GREEN line for BUY and also paints a RED line for SELL. (you can change the colors). It gives alarms and alerts of all kinds. IT DOES NOT REPAINT and can be used for all currency pairs and timeframes. Yes, as easy and simple as that. Even a newbie can use it to make great and reliable trades. NB: For best results, get my other premium indicators for more powerful and reliable signals. Get them here: https://www.m
    FREE
    The Trend Catcher: The Trend Catcher Strategy with Alert Indicator is a versatile technical analysis tool that aids traders in identifying market trends and potential entry and exit points. It features a dynamic Trend Catcher Strategy , adapting to market conditions for a clear visual representation of trend direction. Traders can customize parameters to align with their preferences and risk tolerance. The indicator assists in trend identification, signals potential reversals, serves as a trail
    FREE
    Key level wedge MT5
    Presley Annais Tatenda Meck
    The   Key level wedge MT5   indicator automatically draws rising wedge pattern and falling wedge pattern for you on the chart. This pattern is really good when used as a confirmation entry at key support & resistance, supply & demand and reversal zones. Advantages  The   Key level wedge MT5   block DOES NOT RE-PAINT, giving you confidence when a signal appears and also helps when looking back.  The   Key level wedge MT5   includes an on/off button on the chart to easily keep the charts clean
    Pivot MT5
    Dmitrij Isaenko
    The indicator draws daily support and resistance lines on the chart, as well as the Pivot level (reversal level). Adapted to work in MT5 The standard timeframe for calculating support and resistance levels is D1. You can choose other timeframes according to your strategy (for example, for M1-M15, the optimal timeframe for calculations is H1) The function for calculating support and resistance levels has been updated; in this calculation option, fibonacci levels are taken into account, respec
    FREE
    Weis Waves
    Flavio Javier Jarabeck
    2.83 (18)
    The original author is David Weis, an expert in the Wyckoff Method. The Weis Wave is a modern adaptation of the 1930's Wyckoff Method, another expert in Tape Reading techniques and Chart Analysis. Weis Waves takes market volume and stacks it into waves according to price conditions giving the trader valuable insights about the market conditions. If you want to learn more about this subject you can find tons of videos in YouTube. Just look for "The Wickoff Method", "Weis Wave" and "Volume Spread
    FREE
    BTFX Pivot Points
    Bradley Thomas Farrington
    The BTFX Pivot Points is an indicator which calculates the Support and Resistance levels for each day. By using this indicator the pivot levels point out clear targets to aim for. The resistance levels are shown in purple above the silver pivot line. The support levels are shown in Orange and can be found below the silver pivot line. This indicators works very well when used with The BTFX Daybreak Indicator. For a more in depth explanation of these indicators please watch the Youtube video attac
    This is Gekko's Cutomized Cutomized Average Directional Index (ADX), a customized version of the famous ADX indicator. Use the regular ADX and take advantage two entry signals calculations and different ways of being alerted whenever there is potential entry or exit point. Inputs Period: Period for the ADX calculation; PlotSignalType: How will the indicator calculate entry (swing) signals: 1- ShowSwingsOnTrendLevel : Show Signals for Trend Confirmation Swings; 2- ShowSwingsOnTrendLevelDirection
    Best SAR MT5
    Ashkan Hazegh Nikrou
    4.33 (3)
    Description :  we are happy to introduce our new free indicator based on one of professional and popular indicators in forex market (Parabolic SAR) this indicator is new modification on original Parabolic SAR indicator, in pro SAR indicator you can see cross over between dots and price chart, this crossover is not signal but talk about end of movement potential, you can start buy by new blue dot, and place stop loss one atr before first blue dot, and finally you can exit as soon as dots cross p
    FREE
    Are you tired of drawing trendlines every time you're analyzing charts? Or perhaps you would like more consistency in your technical analysis. Then this is for you. This indicator will draw trend lines automatically when dropped on a chart. How it works Works similar to standard deviation channel found on mt4 and mt5. It has 2 parameters: 1. Starting Bar 2. Number of bars for calculation The   starting bar   is the bar which drawing of the trend lines will begin, while the   number of bars for c
    FREE
    The indicator highlights the points that a professional trader sees in ordinary indicators. VisualVol visually displays different volatility indicators on a single scale and a common align. Highlights the excess of volume indicators in color. At the same time, Tick and Real Volume, Actual range, ATR, candle size and return (open-close difference) can be displayed. Thanks to VisualVol, you will see the market periods and the right time for different trading operations. This version is intended f
    FREE
    LT Donchian Channel
    Thiago Duarte
    4.83 (6)
    Donchian Channel is an indicator created by Richard Donchian. It is formed by taking the highest high and the lowest low of the last specified period in candles. The area between high and low is the channel for the chosen period. Its configuration is simple. It is possible to have the average between the upper and lower lines, plus you have alerts when price hits one side. If you have any questions or find any bugs, please contact me. Enjoy!
    FREE
    Value Chart Candlesticks
    Flavio Javier Jarabeck
    4.73 (11)
    The idea of a Value Chart indicator was presented in the very good book I read back in 2020 , " Dynamic Trading Indicators: Winning with Value Charts and Price Action Profile ", from the authors Mark Helweg and David Stendahl. The idea is simple and the result is pure genius: Present candlestick Price analysis in a detrended way! HOW TO READ THIS INDICATOR Look for Overbought and Oversold levels. Of course, you will need to test the settings a lot to find the "correct" one for your approach. It
    FREE
    Donchian Pro
    Paulo Henrique Faquineli Garcia
    5 (3)
    The Donchian Channel Channels are among the most popular tools of technical analysis, as they visually convey to the analyst the limits within which most price movement tends to occur. Channel users know that valuable information can be obtained at any time, whether prices are in the central region of a band or close to one of the border lines. One of the best known techniques to explore these concepts is Bollinger Bands. However, John Bollinger was not the only one to research the application
    FREE
    Free automatic Fibonacci is an indicator that automatically plots a Fibonacci retracement based on the number of bars you select on the BarsToScan setting in the indicator. The Fibonacci is automatically updated in real time as new highest and lowest values appears amongst the selected bars. You can select which level values to be displayed in the indicator settings. You can also select the color of the levels thus enabling the trader to be able to attach the indicator several times with differe
    FREE
    White Weis Volume Ticks
    Ricardo Almeida Branco
    5 (4)
    White Weis Volume This indicator shows the sum of the volume in each wave, bulish or bearish, as idealized by David Weis , but it brings an important addition , which is the marking of the bar with the highest volume of the wave (White Bar)! In coding the indicator, it was sought to optimize the code to require minimal processing during use and not to overload mt5. The indicator can be used for pre-trading analysis and study, where the trader analyzes possible points of support and resistance
    HMA Trend Professional MT5
    Pavel Zamoshnikov
    4.25 (4)
    Improved version of the free HMA Trend indicator (for MetaTrader 4) with statistical analysis. HMA Trend is a trend indicator based on the Hull Moving Average (HMA) with two periods. HMA with a slow period identifies the trend, while HMA with a fast period determines the short-term movements and signals in the trend direction. The main differences from the free version: Ability to predict the probability of a trend reversal using analysis of history data. Plotting statistical charts for analyzi
    Bollinger Bands B
    Flavio Javier Jarabeck
    5 (1)
    John Bollinger created this indicator in 2010 as a way to read the original indicator (Bollinger Bands) in a more "technical" way, shown as an oscillator. The typical range of the Bollinger Bands %B is 0 - 0.5 - 1.0, where "0" represents the lower band, the "0.5" the middle band, and "1" the upper band. The line on the indicator represents the Closing prices. As simple as that. SETTINGS Bollinger Bands period of analysis Standard Deviation multiplier Shift Price type to be analyzed If you like
    FREE
    Donchian Channel DC is the indicator of Donchian Channels, that plots maximum and minimum values of a specific period, besides mean value line. It´s possible to configure simple period for analysis and the indicator will plot all three values. You can trade with this indicator as trend or reversal, according to each strategy. Do not let to test others indicators as soon as others expert advisors.
    This indicator will show you the TP and SL Values (in that currency) that you already set  for every orders on the charts  ( closed to the transaction/order line)  that will help you a lot to estimated your profit and loss for every order.    And it also show you the PIPs values too.  the shown format  is      " Currency Values of our Profit or Loss /  PIPs values ".    The TP Value will be shown in Green Color and  the SL Value  will be shown in Red Color.  For any question or more information,
    Weis Waves RSJ
    JETINVEST
    4.5 (8)
    The Weis Waves RSJ Indicator sums up volumes in each wave. This is how we receive a bar chart of cumulative volumes of alternating waves. Namely the cumulative volume makes the Weis wave charts unique. It allows comparing the relation of the wave sequence characteristics, such as correspondence of the applied force (expressed in the volume) and received result (the price progress). If you still have questions, please contact me by direct message:  https://www.mql5.com/en/users/robsjunqueira/
    FREE
    Tabajara V5
    Flavio Javier Jarabeck
    4.85 (33)
    Metatrader 5 version of the famous Andre Machado's Tabajara indicator. If you don't know Andre Machado's Technical Analysis work you don't need this indicator... For those who need it and for those several friend traders who asked this porting from other platforms, here it is... FEATURES 8-period Moving Average 20-period Moving Average 50-period Moving Average 200-period Moving Average Colored candles according to the inflexion of the 20-period MA SETTINGS You can change the Period of all MA's
    FREE
    Blahtech VWAP MT5
    Blahtech Limited
    5 (1)
    Was: $69  Now: $49   Blahtech VWAP - Volume Weighted Average Price (VWAP) is the ratio of price to total volume. It provides an average price over a specified time interval.  Links [  Install  |  Update  |  Documentation   ] Feature Highlights Configurable VWAP Line Sessions, intervals, anchored or continuous Previous day settlement line Standard Deviation bands Alerts at bar close or real time Automatic Broker or Tick volumes Significantly reduced CPU usage Input Parameters Expert Advisor Mo
    Automatic Trendlines
    Pasi Hakamaki
    4.64 (42)
    The indicator draws trendlines on chart. This indicator has six inputs. User can specify alternative labels for both lines. If multiple instances of the indicator are used, the labels must differ. User can set width and color of the lines and depth which specifies what significant peaks should be used. For example, Depth=10 sets trendlines using the current peaks and valleys that have at least 10 bars to the right and to the left and that have highs/lows less/greater than the peak's high/low. In
    FREE
    Half ma
    Artem Svistunov
    The Half ma arrow indicator for the MetaTrader 5 trading terminal is a simple but effective tool that gives a signal about a change in the current trend. The Half ma indicator looks like a solid dynamic line that changes color at the points where the trend changes. At these points, the indicator draws arrows of the corresponding color and direction.The Half ma arrow indicator for the MT5 terminal is not an independent source of input signals. It will be most effective to use it as a trend filte
    Bar Color Trend
    Germano Chagas
    4.38 (8)
    Combining the best of Price Action , Directional Movement , and Divergence/Convergence analysis, Candle Color Trend is a easy and reliable way to identify trend direction. The indicator automatically paints the candles according to the assumption that an uptrend is defined by prices that form a series of higher highs and higher lows. In contrast, a downtrend is defined by prices that form a series of lower highs and lower lows. Additionally, ADX Wilder indicator is used to measure trend weakness
    FREE
    The Penta-O is a 6-point retracement harmonacci pattern which usually precedes big market movements. Penta-O patterns can expand and repaint quite a bit. To make things easier this indicator implements a twist: it waits for a donchian breakout in the right direction before signaling the trade. The end result is an otherwise repainting indicator with a very reliable trading signal. The donchian breakout period is entered as an input. [ Installation Guide | Update Guide | Troubleshooting | FAQ | A
    This z-score indicator shows the correct z-score of an asset, as it uses the normalized price data for calculation, which is the only correct way. Z-score is only applicable for normal distributed data, therefore not the actual price is considered, but the normalised returns, which were assumed to follow a normal distribution. Returns are mean reverting and assumed to follow a normal distribution, therefore z-score calculation of returns is more reliable than z-score on price, as price is NOT m
    Multi ZigZag
    Jose Freitas Alves Neto
    # Indicador MultiZigZag Pro para MetaTrader 5 O MultiZigZag Pro é um poderoso indicador técnico para a plataforma MetaTrader 5 que identifica, de forma inteligente e flexível, os principais pontos de inflexão e tendências nos gráficos de preços. ## Características principais: - Algoritmo avançado que filtra ruídos e movimentos irrelevantes do mercado  - Múltiplos timeframes para análise de tendências de curto a longo prazo - Parâmetros de profundidade e desvio personalizáveis para adaptação a
    Designed by Welles Wilder for daily commodity charts, the ADXW is now used in various markets by technical traders to assess the strength of a trend or even a trend for short- or long-term trades. The ADXW uses a positive (DI+) and negative (DI-) directional indicator in addition to its trend line (ADX). According to Wilder, a trend has strength when the ADX signal is above 25; the trend is weak (or the price has no trend) when the ADX is below 20. The absence of a trend does not mean that th
    Buyers of this product also purchase
    Trend Screener Pro MT5
    STE S.S.COMPANY
    4.88 (68)
    Unlock the Power of Trends Trading with the Trend Screener Indicator: Your Ultimate Trend Trading Solution powered by Fuzzy Logic and Multi-Currencies System! Elevate your trading game with the Trend Screener, the revolutionary trend indicator designed to transform your Metatrader into a powerful Trend Analyzer. This comprehensive tool leverages fuzzy logic and integrates over 13 premium features and three trading strategies, offering unmatched precision and versatility. LIMITED TIME OFFER : Tre
    TPSpro RFI Levels MT5
    Roman Podpora
    4.71 (17)
    A key element in trading is zones or levels from which decisions to buy or sell a trading instrument are made. Despite attempts by major players to conceal their presence in the market, they inevitably leave traces. Our task was to learn how to identify these traces and interpret them correctly. ИНСТРУКЦИЯ RUS         INSTRUCTIONS  ENG         R ecommended to use with an indicator   -   TPSpro  TREND PRO -  Version MT4 Main functions:: Displaying active zones for sellers and buyers! The indicat
    TPSproTREND PrO MT5
    Roman Podpora
    4.54 (13)
    TPSpro TREND PRO  - is a trend indicator that automatically analyzes the market and provides information about the trend and each of its changes, as well as giving signals for entering trades without redrawing! The indicator uses each candle, analyzing them separately. referring to different impulses - up or down impulse. Exact entry points into transactions for currencies, crypto, metals, stocks, indices!  ИНСТРУКЦИЯ RUS         INSTRUCTIONS  ENG       R ecommended to use with an indicator   -
    FX Volume MT5
    Daniel Stein
    4.93 (15)
    FX Volume: Experience Genuine Market Sentiment from a Broker’s Perspective Quick Overview Looking to elevate your trading approach? FX Volume provides real-time insights into how retail traders and brokers are positioned—long before delayed reports like the COT. Whether you’re aiming for consistent gains or simply want a deeper edge in the markets, FX Volume helps you spot major imbalances, confirm breakouts, and refine your risk management. Get started now and see how genuine volume data can
    Quantum TrendPulse
    Bogdan Ion Puscasu
    5 (7)
    Introducing Quantum TrendPulse , the ultimate trading tool that combines the power of SuperTrend , RSI , and Stochastic into one comprehensive indicator to maximize your trading potential. Designed for traders who seek precision and efficiency, this indicator helps you identify market trends, momentum shifts, and optimal entry and exit points with confidence. Key Features: SuperTrend Integration: Easily follow the prevailing market trend and ride the wave of profitability. RSI Precision: Detect
    Top indicator for MT5   providing accurate signals to enter a trade without repainting! It can be applied to any financial assets:   forex, cryptocurrencies, metals, stocks, indices .  Watch  the video  (6:22) with an example of processing only one signal that paid off the indicator! MT4 version is here It will provide pretty accurate trading signals and tell you when it's best to open a trade and close it. Most traders improve their trading results during the first trading week with the help of
    FX Levels: Exceptionally Accurate Support & Resistance for All Markets Quick Overview Looking for a reliable way to pinpoint support and resistance levels across any market—currencies, indices, stocks, or commodities? FX Levels merges our traditional “Lighthouse” method with a forward-thinking dynamic approach, offering near-universal accuracy. By drawing from real-world broker experience and automated daily plus real-time updates, FX Levels helps you identify reversal points, set profit targe
    Golden Trend Indicator MT5
    Noha Mohamed Fathy Younes Badr
    4.86 (14)
    Golden Trend indicator  is The best indicator for predicting trend movement this indicator never lags and never repaints and never back paints    and give  arrow buy and sell    before the candle appear  and it will help you and  will make your trading decisions clearer its work on all currencies and  gold and crypto and all time frame This unique  indicator uses very secret algorithms to catch the  trends, so you can trade using this indicator and see the trend clear on charts  manual guide and
    FX Dynamic: Take Your Market Analysis to the Next Level with Adaptive Precision Quick Overview Looking to sharpen your trading edge? FX Dynamic delivers real-time, adaptive insights into market movements—instantly reacting to every tick of live MetaTrader data. Whether you’re aiming for consistent performance or just want deeper, more reliable signals, FX Dynamic helps you identify key opportunities, refine your entries and exits, and manage risk with greater precision. Get started now and dis
    How many times have you bought a trading indicator with great back-tests, live account performance proof with fantastic numbers and stats all over the place but after using it, you end up blowing your account? You shouldn't trust a signal by itself, you need to know why it appeared in the first place, and that's what RelicusRoad Pro does best! User Manual + Strategies + Training Videos + Private Group with VIP Access + Mobile Version Available A New Way To Look At The Market RelicusRoad is th
    First of all Its worth emphasizing here that this Trading Tool is Non Repainting , Non Redrawing and Non Lagging Indicator , Which makes it ideal for professional trading . Online course, user manual and demo. The Smart Price Action Concepts Indicator is a very powerful tool for both new and experienced traders . It packs more than 20 useful indicators into one , combining advanced trading ideas like Inner Circle Trader Analysis and Smart Money Concepts Trading Strategies . This indicator focus
    Support And Resistance Screener Breakthrough unique Solution With All Important levels analyzer and Markets Structures Feature Built Inside One Tool ! Our indicator has been developed by traders for traders and with one Indicator you will find all Imporant market levels with one click. LIMITED TIME OFFER : Support and Resistance Screener Indicator is available for only 50 $ and lifetime. ( Original price 125$ ) (offer extended) The available tools ( Features ) in our Indicator are :  1. HH-LL S
    FX Power MT5 NG
    Daniel Stein
    5 (8)
    FX Power: Analyze Currency Strength for Smarter Trading Decisions Overview FX Power is your go-to tool for understanding the real strength of currencies and Gold in any market condition. By identifying strong currencies to buy and weak ones to sell, FX Power simplifies trading decisions and uncovers high-probability opportunities. Whether you’re looking to follow trends or anticipate reversals using extreme delta values, this tool adapts seamlessly to your trading style. Don’t just trade—trade
    Gold Stuff mt5
    Vasiliy Strukov
    4.92 (173)
    Gold Stuff mt5 is a trend indicator designed specifically for gold and can also be used on any financial instrument. The indicator does not redraw and does not lag. Recommended time frame H1. Contact me immediately after the purchase to get   personal bonus!  You can get a free copy of our Strong Support and Trend Scanner indicator, please pm. me! Settings  and manual   here   SETTINGS Draw Arrow - on off. drawing arrows on the chart. Alerts -   on off audible alerts. E-mail notification - on of
    Gold Venamax MT5
    Sergei Linskii
    2.67 (3)
    Gold Venamax - this is a best stock technical indicator. The indicator algorithm analyzes the price movement of an asset and reflects volatility and potential entry zones. Indicator features: This is a super indicator with Magic and two Blocks of trend arrows for comfortable and profitable trading. Red Button for switching blocks is displayed on the chart. Magic is set in the indicator settings, so that you can install the indicator on two charts displaying different Blocks. Gold Venamax can be
    First of all Its worth emphasizing here that this Trading System is Non-Repainting   , Non Redrawing and Non Lagging Indicator Which makes it ideal from both manual and robot trading .  Online course, manual and download presets. The Smart Trend Trading System MT5 is a comprehensive trading solution tailored for new and experienced traders . It combines over 10 premium indicators and features more than 7 robust trading strategies , making it a versatile choice for diverse market conditions . Tre
    ATrend
    Zaha Feiz
    4.73 (11)
    ATREND: How It Works and How to Use It How It Works The " ATREND " indicator for the MT5 platform is designed to provide traders with robust buy and sell signals by utilizing a combination of technical analysis methodologies. This indicator primarily leverages the Average True Range (ATR) for volatility measurement, alongside trend detection algorithms to identify potential market movements. Leave a massage after purchase and receive a special bonus gift. Key Features: ⦁ Dynamic Trend Detect
    IX Power MT5
    Daniel Stein
    4.17 (6)
    IX Power: Unlock Market Insights for Indices, Commodities, Cryptos, and Forex Overview IX Power is a versatile tool designed to analyze the strength of indices, commodities, cryptocurrencies, and forex symbols. While FX Power offers the highest precision for forex pairs by leveraging all available currency pair data, IX Power focuses exclusively on the underlying symbol’s market data. This makes IX Power an excellent choice for non-forex markets and a reliable option for forex charts when deta
    Easy Breakout MT5
    Mohamed Hassan
    5 (1)
    Enjoy a   50% OFF   Christmas holiday sale!   After your purchase, feel free to contact me for more details on how to receive a bonus indicator called VFI, which pairs perfectly with Easy Breakout for enhanced confluence!     Easy Breakout MT5   is a powerful price action trading system built on one of the most popular and widely trusted strategies among traders: the   Breakout strategy ! This indicator delivers crystal-clear Buy and Sell signals based on breakouts from key support and resis
    Introducing   Quantum Breakout PRO , the groundbreaking MQL5 Indicator that's transforming the way you trade Breakout Zones! Developed by a team of experienced traders with trading experience of over 13 years,   Quantum Breakout PRO   is designed to propel your trading journey to new heights with its innovative and dynamic breakout zone strategy. Quantum Breakout Indicator will give you signal arrows on breakout zones with 5 profit target zones and stop loss suggestion based on the breakout b
    Was: $249  Now: $149   Market Profile defines a number of day types that can help the trader to determine market behaviour. A key feature is the Value Area, representing the range of price action where 70% of trading took place. Understanding the Value Area can give traders valuable insight into market direction and establish the higher odds trade. It is an excellent addition to any system you may be using. Inspired by Jim Dalton’s book “Mind Over Markets”, this indicator is designed to suit the
    - Lifetime update free -   Real price is 80$   - 25% Discount ( It is 59$ now ) Contact me for instruction, any questions! Related Product:  Gold Trade Expert MT5 - Non-repaint Introduction The breakout and retest strategy is traded support and resistance levels. it involves price breaking through a previous level.  The break and retest strategy is designed to help traders do two main things, the first is to avoid false breakouts. Many false breakouts start with a candlestick that breaks out o
    Matrix Arrow Indicator MT5
    Juvenille Emperor Limited
    5 (13)
    Matrix Arrow Indicator MT5  is a unique 10 in 1 trend following   100% non-repainting  multi-timeframe indicator that can be used on all symbols/instruments:   forex,   commodities,   cryptocurrencies,   indices,   stocks .  Matrix Arrow Indicator MT5  will determine the current trend at its early stages, gathering information and data from up to 10 standard indicators, which are: Average Directional Movement Index (ADX) Commodity Channel Index (CCI) Classic Heiken Ashi candles Moving Average
    Blahtech Supply Demand MT5
    Blahtech Limited
    4.54 (13)
    Was: $299  Now: $149  Supply Demand uses previous price action to identify potential imbalances between buyers and sellers. The key is to identify the better odds zones, not just the untouched ones. Blahtech Supply Demand indicator delivers functionality previously unavailable on any trading platform. This 4-in-1 indicator not only highlights the higher probability zones using a multi-criteria strength engine, but also combines it with multi-timeframe trend analysis, previously confirmed swings
    DESCRIPTION ICSM (Impulse-Correction SCOB Mapper) is the indicator that analyzes the price movement and identifies valid impulses, corrections and SCOBs (Single Canndle Ordere Block). It is a powerful tool that can be used with any type of technical analysis because it's flexible, informative, easy to use and it does substantially improve trader's awareness of the most liquid zones of interest. SETTINGS General | Visuals Colour theme — defines the colour theme of the ICSM. SCOB | Visuals Show
    Trend Line Map Pro MT5
    STE S.S.COMPANY
    4.09 (11)
    Trend Line Map indicator is an addons for   Trend Screener Indicator . It's working as a scanner for all signals generated by Trend screener ( Trend Line Signals ) . It's a Trend Line Scanner based on Trend Screener Indicator.  If you don't have Trend Screener Pro Indicator,   the Trend Line Map Pro will not work.     LIMITED TIME OFFER : Trend Line Map Indicator is available for only 50 $ and lifetime. ( Original price 125$ ) By accessing to our MQL5 Blog,  you can find all our premium indicat
    Trend Forecaster
    Alexey Minkov
    5 (6)
    !SPECIAL SALE!  The Trend Forecaster indicator utilizes a unique proprietary algorithm to determine entry points for a breakout trading strategy. The indicator identifies price clusters, analyzes price movement near levels, and provides a signal when the price breaks through a level. The Trend Forecaster indicator is suitable for all financial assets, including currencies (Forex), metals, stocks, indices, and cryptocurrencies. You can also adjust the indicator to work on any time frames, althoug
    Trade smarter, not harder: Empower your trading with Harmonacci Patterns Special Offer: Purchase now to receive free bonuses worth $165! (Read more for details) This is arguably the most complete harmonic price formation auto-recognition indicator you can find for the MetaTrader Platform. It detects 19 different patterns, takes fibonacci projections as seriously as you do, displays the Potential Reversal Zone (PRZ) and finds suitable stop-loss and take-profit levels. [ Installation Guide | Upd
    Atomic Analyst MT5
    Issam Kassas
    4.32 (19)
    First of all Its worth emphasizing here that this Trading Indicator is   Non-Repainting   , Non Redrawing and Non Lagging Indicator   Indicator, Which makes it ideal from both manual and robot trading.  User manual: settings, inputs and strategy . The Atomic Analyst  is a PA Price Action Indicator that uses Strength and Momentum of the price to find a better edge in the market. Equipped with Advanced filters which help remove noises and false signals, and Increase Trading Potential. Using Multi
    Gold Trend 5
    Sergei Linskii
    5 (1)
    Gold Trend - this is a good stock technical indicator. The indicator algorithm analyzes the price movement of an asset and reflects volatility and potential entry zones. The best indicator signals: For SELL = red histogram + red SHORT pointer + yellow signal arrow in the same direction. For BUY = blue histogram + blue LONG pointer + aqua signal arrow in the same direction. Benefits of the indicator: The indicator produces signals with high accuracy. A confirmed arrow signal can only be redrawn
    More from author
    HFTHackerMT5
    Thomas Bradley Butler
    5 (3)
    * THIS IS AN OLD EA WITH MANY EVOLUTIONS.  SHOW SUPPORT FOR MY WORK .  THIS HAS GONE BACK TO THE SIMPLE VERSION WITHOUT RECOVERY.  IF YOU BOUGHT PRVIOUS VERSION BELOW 15 WITH RECOVERY THEN DO NOT USE 15. OPTIMIZE EA BEFORE TEST AND USE. ONLY BUY IF YOU HAVE OPTIMIZED.  This is  for  traders who know how to optimize  and want to be profitable on their own merit.    YOU  SET YOUR RISK PARAMETERS.   High win rate with stops for the trades that don't work out if you choose. Reduce risk for longevit
    Gold M1
    Thomas Bradley Butler
    Optimize before back test and use.  Get the stop Loss and Take profit on the optimizer right for pip/point values.    No EA will turn hundreds into millions in short periods, this is a lie. Not many EA's trade 1 min charts, let alone for Gold.  This EA is unique and trades XAU/USD on 1 min time frames using candlesticks and Commodity Channel Index. Adjust the inputs accordingly, optimize. Use a VPS to trade by or just use for day trading purposes.  Recommended for day trading but try for differ
    Black Gold M1
    Thomas Bradley Butler
    OPTIMIZE BEFORE BACKTEST AND USE Trade crude oil with this EA.  No EA turns hundreds into millions in a year or 2, This is a lie if presented this way.  Black Gold trades Brent Crude on 1 min charts.  It uses RSI, moving averages and directional indicators.  Try it out, load it onto the tester if you have the history and ability to trade Brent crude.    Adjust and optimize to get the most out of the expert advisor
    ForexReversal
    Thomas Bradley Butler
    4 (1)
    Patience is key to stress free scalping. Trade the arrows when you see it passes the 200 moving average and make a trend by widening out or from the last swing point with no moving average filter.   Nice for 1 minute time frames, catching momentum intraday moves. Take 20 pips with ease or stay longer for bigger trends, using trailing stops.  Look at the examples in the photos of really big trades from this indicator.  Time frames of 1 minute work the best.  Zoom out to see the trends.  Arrows do
    NeuroScalper
    Thomas Bradley Butler
    5 (1)
    Update!   Arrows were added to the 100 and 200 levels on oscillator  MT5 version: https://www.mql5.com/en/market/product/72378 This indicator is accurate for accessing extremes and supports for buy positions primarily for 1 minute time frames.  Other time frames can be used but the levels are different, and you need to add them manually, just use averages of extremes. It's a better oscillator and compares with others to see the difference.   Day trade using neuro network concepts.  This indic
    VolumeDayTrader
    Thomas Bradley Butler
    DAYTRADING FOR STOCKS(CFD's)or other assets showing volume. Trading takes work.  There are no shortcuts or indicators that will tell you all the entries and exits.  Profit comes from the state of mind.  Indicators are tools to be used in conjunction with money management and success psychology.  Find imbalances in the volume profile. Trade price volume imbalances.  Many imbalances happen at the close and open and news. See the buyers vs. sellers in stocks.  Use on 5 minutes to 1 hour to see who
    GoldBuyBackScalper
    Thomas Bradley Butler
    4 (1)
    This indicator is for XAU/USD and uses standard deviations. For1 minute charts only.   Every pair has unique characteristics and price movements. Trade V shaped reversals with this indicator. Scalp buys  using trailing stops and   avoid news   as they are more extreme and can cause sudden sell offs . Attach to 1 minute time frame in backtest and see the reversal buys.  Indicator never repaints or recalculates. TRADE DURING ACTIVE HOURS ONLY
    TrueSupplyandDemand
    Thomas Bradley Butler
    This is based on short term strength or weakness and not on moving averages.  Moving averages are used for filter only. Trade supply and demand with arrows. Supply and demand breakouts and strength of the buyers or sellers .  Don't trade buy arrow to sell arrow.  Trade the strength with trendlines or moving averages and use stops.  The arrow can have some strong moves.  Trade on all time frames.  Try it out in the back tester. The pips can be made with this indicator, follow the arrows and make
    ScalpingMaster
    Thomas Bradley Butler
    Master scalping with this indicator.  Trade on any time frame for scalps on buy or sells.  Follow trends using a 200 moving average and stops and targets.  Use with your own system.  This indicator can give pips if following it correctly.  Stick to rules and pick up pips daily.  Use as entries in a trend, scalp for a few pips or exit on opposite signal.  Best to follow higher time frame trends. Indicator doesn't repaint or recalculate. Rules: Don't trade overnight, only trade during active sessi
    DayTradeKing
    Thomas Bradley Butler
    This indicator is good for small time frames like 1 and 5 minutes and made for day trading. The indicator never repaints or recalculates. The indicator works is for trading swing points in day trading, following bulls or bears.  Its a simple to use, non cluttered indicator with a high success rate.  This indicator works well to capture ranges.  All indicators come with limitations and no indicator or system is always accurate. Use money management for long term trading success.   Place in backte
    DTKGold
    Thomas Bradley Butler
    This is the DayTradeKing for gold on a 1 minute time frame.  It is a different calculation for the range. Use a 200 period moving average as a filter.  Always use stops and avoid news, wait for more conformation.  This looks to capture intraday ranges. Put it in the back tester on 1 minute to see the price action and how it works. Trade with trend Use filter Use stops Alerts are added for pop ups and sound. 
    SuperArrowScalper
    Thomas Bradley Butler
    Trade trends with the Super Scalper Use on all time frames and assets it is  designed for scalping trends. Works good on small time frames for day trading.  The arrows are easy to follow.  This is a simple no repaint/no recalculate arrow indicator to follow trends with.  Use in conjunction with your own system or use moving averages.  Always use stops just below or above the last swing point or your own money management system The indicator comes with push notifications, sound alerts and email
    Levels Trading
    Thomas Bradley Butler
    This indicator is a simple stripped down version of any advanced support and resistance indicator.  All the support and resistance indicators work from a number of bars that have developed over time. Get rid of clutter and confusing levels.  Find levels according to a number of bars. Look at days, session, numbers of hours, periods of consolidation.  Watch levels develop and use as breakout points, or areas of buyers and sellers.  Features and things to consider This indicator is for a frame of
    ForexReversalEA
    Thomas Bradley Butler
    Optimize Inputs  https://www.mql5.com/en/market/product/57345 This EA is based on the Forex Reversal indicator.  If you prefer to manual trade the system, download the indicator and try it out. The EA will follow the trend and open positions accordingly.   The results show stable gains with lower drawdown but experiment with it in the back tester, optimizer and time frames to see what works.  All results shown are hypothetical. Note: This is not a martingale or grid. the EA does have hedging cap
    HFTHacker
    Thomas Bradley Butler
    * THIS IS AN OLD EA WITH MANY EVOLUTIONS.  SHOW SUPPORT FOR MY WORK .  THIS HAS GONE BACK TO THE SIMPLE VERSION WITHOUT RECOVERY. IF YOU BOUGHT PRVIOUS VERSION BELOW 15 WITH RECOVERY THEN DO NOT USE 15. OPTIMIZE EA BEFORE TEST AND USE. ONLY BUY IF YOU HAVE OPTIMIZED.  This is  for  traders who know how to optimize  and want to be profitable on their own merit.    YOU  SET YOUR RISK PARAMETERS. High win rate with stops for the trades that don't work out if you choose. Reduce risk for longevity.
    MarketMaker
    Thomas Bradley Butler
    OPTIMIZE BEFORE BACKTEST AND USE. *UPDATE:  This can be traded on on pair.  Just have the TP more than the SL.  And have one side with a larger lot size than the other.   Automate supply and demand trading. Make a market. Read and understand before posting negativity. Take responsibility for your own trading. Create your own optimization This EA was made and inspired by the popular supply and demand indicator everyone sells and mimics.  The  EA continues trading and hedging, making a market.  C
    Top Trader
    Thomas Bradley Butler
    Top Trader Indicator This is an arrow reversal indicator. This is with deviations and arrows.  Trade a blue arrow for buy and trade a red arrow for sell.  Change the time period and the deviations of the bands.  This is similar to others but these arrows don't repaint.  Load in back tester and study which periods and deviations work the best.  It works on all time frames.  15 min to 1 hr would give good results for take profits.  Try according to your own risk management.

    Quant Bot
    Thomas Bradley Butler
    OPTIMIZE EA BEFORE TEST AND USE No EA turns hundreds into millions in a year or 2.  This is a lie if presented this way.     Quant Bot is for trend trading on the one-hour time frame for the EUR/USD.  There is no set file but if other pairs are used, then it may need optimization.     About the bot: It uses genetic generation and uses ATR to trade by. Walk forward period was used to prevent curve fit The EA uses stops on every trade. Money management is a scaling up with % of balance The back
    Crypto Net
    Thomas Bradley Butler
    OPTIMIZE EA BEFORE TEST AND USE MT5 version of Crypto Net:  https://www.mql5.com/en/market/product/84115 UPDATED WITH ADVANCE MONEY MANAGEMENT INPUTS.   NOTE:  PUT INPUTS TO 50000 min. The broker times will be different than what the strategy was built in. Crypto Net is for trading BTCUSD .  It uses genetic evolution to evolve the strategy. This EA trades trend following indicators like ATR and Ichimoku. This was built and passed a range of robust testing including Monte Carlo and Walk Forwa
    PropTrader
    Thomas Bradley Butler
    *OPTMIZE EA BEFORE USE* Optimized Forex Trading Strategy for EUR/USD Achieving substantial wealth within a year or two with an Expert Advisor (EA) is an unrealistic claim. Back testing and real trading focus on the EUR/USD currency pair. About This Strategy: This represents the initial iteration of our strategy, with the potential for further advancements. Rigorously tested with 100% quality data, it's free from MT4 errors. The strategy operates on a logical principle of trend following. When th
    Down Under
    Thomas Bradley Butler
    OPTIMIZE EA BEFORE TEST AND USE Down Under trades the AUD/USD pair on a 1 hour time frame. No EA turns hundreds into millions in a year or 2.  This is a lie if presented this way.  This EA trades the ATR and OHLC.  It is formatted for this pair on this time frame.  Compounding is used with a min. lot size and a max. lot size.  The percentage of the balances is compounded on winning trades.  As the balance fluctuates, so does the lot size. Settings: mm risk % mm lots max lots There is nothing
    Cable Trader
    Thomas Bradley Butler
    UPDATE:  Changed to % of balance in lot size. OPTIMIZE,OPTIMIZE,OPTIMIZE! GBP/USD 1 hr. built with machine learning  No EA turns hundreds into millions in a year or 2.  This is a lie if presented this way.   This EA trades momentum and sessions.  This has a fixed lot component and will continue to modify the TP as it develops. Settings: Lot size There is nothing else to change.  This has no martingale or hedging capabilities.  Only other feature to change is if you are trading, CFD's of GBP/USD
    Euclidean
    Thomas Bradley Butler
    OPTIMIZE EA BEFORE TEST AND USE Updated:  Added a sell option to hedge as risk management.  No EA turns hundreds into millions in a year or 2.  This is a lie if presented this way.   Euclidean   is a unique trading algorithm  that I came up with 8 years ago.  This EA is part of this system.  It works as a closed system.  The EA will initiate a buy when the angle degree is correct to catch a trend.  The stop loss is 10% from the angle.  It is that simple. Inputs:  % of balance in lots  1 mic
    Pip Scalper
    Thomas Bradley Butler
    AN INDICATOR FOR EVERYONE MT5:  https://www.mql5.com/en/market/product/80934 Pip Scalper is for scalping trends.  Stay in trends longer with this indicator.  It works on all time frames and assets.  Pick up daily pips with this tool.  Use the 200 moving average to filter trades.  Smaller time frames recommended.  Use for day trading. About and how to use: Pips Scalper is based on longer term trend trading.   Buy on blue Sell on Red Use 200 moving average as filter and trade during active perio
    Evolved Trends
    Thomas Bradley Butler
    OPTIMIZE BEFORE TEST AND USE TO FIND BEST INPUTS Hey there traders! Want a cutting-edge Expert Advisor for your MT4 platform? Look no further than Evolved Trends! This powerful trading algorithm, created with machine learning technology, focuses on trading GBP/USD on 1 Hour time frames. But hey, feel free to experiment with other assets and time frames for optimization! Just customize the inputs to match your own risk tolerance. With stops based on ATR and the ability to lock in profits and cu
    Combine Winner
    Thomas Bradley Butler
    Trade any Forex combine out there.  Many prop firms offer challenge or instant funding combines.  The biggest problem is controlling the loss.  With this indicator you can get a visual system that can limit loss and teach discipline.  This uses the MACD and the strategy is scalping.  You can determine the risk and reward.  Visually follow small trends for scalps.  Trade during active sessions.  It's just a simple system to instill discipline while limiting loss and scalping pips with the paramet
    Holy Grail Arrow
    Thomas Bradley Butler
    Holy Grail arrow is for scalping.  The period you use will determine the trend.  You can try different time frames and periods to see what works best for your strategy.  Filters can be applied like a moving average or trendlines.  The 1 minute works good for scalps and always trade during active periods and avoid consolidation times.  Using other indicators to determine trends is recommended but this can also be a free flowing scalping system alone with tp and sl. Inputs: Period = trend period
    Twenty Eight Forex Pairs
    Thomas Bradley Butler
    OPTIMIZE EA BEFORE TEST AND USE No EA turns hundreds into millions in a year or 2.  This is a lie if presented this way. Trade Twenty Eight Forex Pairs.  Use this EA to trade the pairs and time frames with tp and sl according to risk.  This comes with advanced money management built in.  It has break evens and take profits on 50% with sl and tp accordingly.  1 hour recommended but try on others for intraday or swing trading.
    Fulltrend
    Thomas Bradley Butler
    Improve trading with this indicator.  Find areas of buys or sells in Fibonacci retracement areas.  Fulltrend is for scalping and making swing trades.  Fib levels are added for take profits and stop losses. This works on any time frame and can be used by itself or together with other systems and indicators for filters. The indicator doesn't repaint.  Alerts are added and can be true or false.  No need to sit glued to the computer, just set on charts and listen or the alerts to come.  Take a posi
    Scalping Code
    Thomas Bradley Butler
    Scalping Code is for trend scalping.  It is simple to use and is profitable.  It can work on any time frame and any asset.  This indicator can be used on it's own or together with another system.  The arrow does not repaint or recalculate.   The rules are as follows:   A blue arrow above the moving average is a buy. An exit for the buy above the moving average is a red arrow or target. A red arrow below the moving average is a sell. An exit for the red below the moving average is a blue arrow
    Filter:
    Konstantin Remezov
    1138
    Konstantin Remezov 2022.02.03 19:56 
     

    User didn't leave any comment to the rating

    Reply to review