SMTrendLine
- Indicators
- Sergei Makarevich
- Version: 2.2
The SMTrendLine indicator is based on the principles of graphical construction of Bollinger bands.
Graphically, the Bollinger is two lines that limit the price dynamics from above and from below, respectively. These are a kind of support and resistance lines, which most of the time are located at levels far from the price.
As we know, the Bollinger bands are similar to the envelopes of moving averages. The difference between them is that the envelope boundaries are located above and below the moving average curve at a fixed distance expressed as a percentage, while the boundaries of the Bollinger bands are constructed at distances equal to a certain number of standard deviations. Since the value of the standard deviation depends on the volatility, the bands themselves adjust their width: it increases when the market is unstable, and decreases in more stable periods.
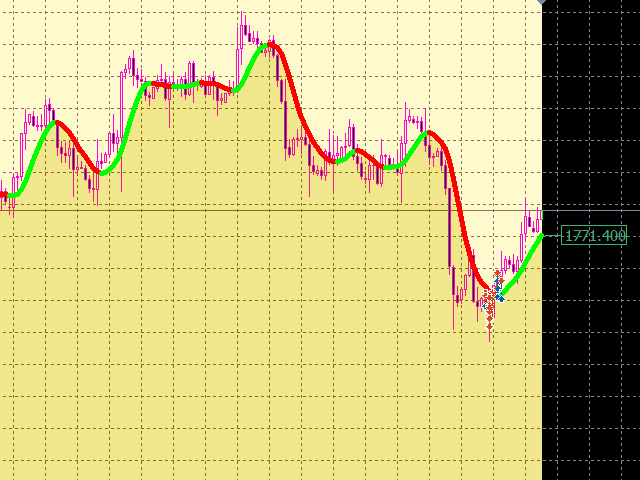
All these data are combined into a common graphical model, which appears to us on the chart in the form of a band that changes color depending on the trend.
This indicator works on any timeframe. The trend line is not redrawn. To determine the entry point, I recommend using an additional second indicator on an older timeframe and entering the market when the price movement directions coincide on both indicators.
In the future, the SMTrendLine indicator will receive an update, where an information panel will appear. I would be very grateful for your feedback and your vision of what information you would like to see on this panel.
It is also planned to use this indicator as part of the Expert Advisor. I will also provide information about this in the description here on the page.












excellent