Aggression Monitor FX
- Indicators
- Flavio Javier Jarabeck
- Version: 1.0
- Activations: 20
Would you like to monitor the aggression between Buyers and Sellers, minute by minute? Now you can! Welcome to the Aggression Monitor FX!
The Aggression Monitor FX indicator was developed for those markets that do not provide REAL data Volume, i.e. like the Forex market.
We developed a way to use 1-minute Tick Volume data generated by Forex (and other) Brokers and manipulate it into "aggression" information in a very visual histogram with additional analysis lines. And it worked! (but hey! you don't have to believe us, you can test our totally free demonstration version for yourself into your charts - instructions below).
And also, it is NOT only for Forex, since this indicator also has the option to switch it to Real Volume, where available!
But Does the Tick Volume is As Good As Real Volume?
According to Caspar Marney - a veteran Forex Trader, you can check his profile on Linkedin - conducted a study published on the FX Trader Magazine, April-June 2011, with the title of "Are price updates a good proxy for actual traded volume in FX?", and he found that the correlation between the two is in the range of 90% or more!
HOW TO "READ" THIS INDICATOR
- Using classical Technical Analysis you already know, you can confirm several patterns and confluences with the Aggression Monitor FX.
- Wyckoff fans will enjoy this additional Volume information.
- Scalpers can use this indicator to find exhaustion and continuation points (M5 timeframes and above).
- This is a non-lagging indicator (well, it is a little bit since it is paced at the 1-minute frequency) you can use to support and confirm all your strategy decisions.
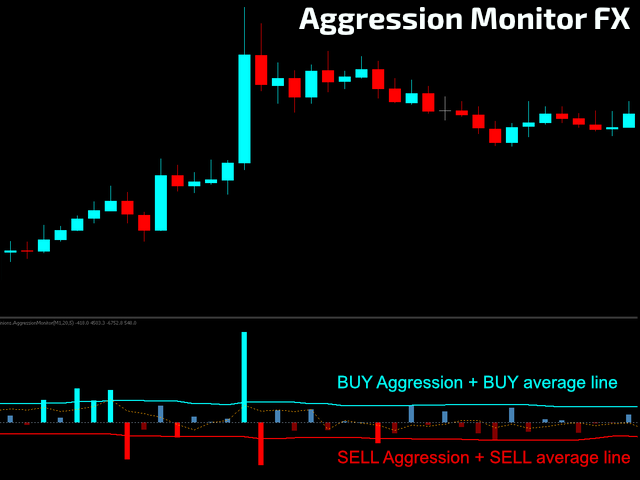
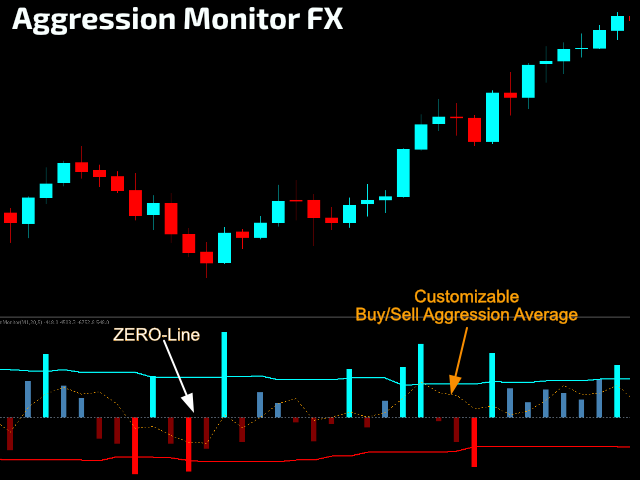
- There are 2 isolated average lines: one for the BUY pressure and another for the SELL pressure. When the aggression volume surpasses the average, the histogram will light up.
- There is also a third average line that represents the BUY/SELL pressure Delta, which you can use as a thermometer of Volume Direction. You can use it as a reference of power when it is Above/Below the indicator Zero-Line. You can shorten or expand its period of analysis to capture data for your ENTRY/EXIT strategies.
- It could be also very useful for creating Stop Loss strategies.
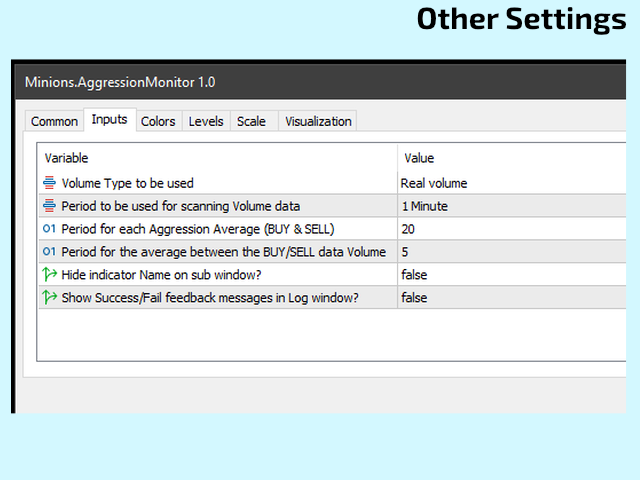
SETTINGS
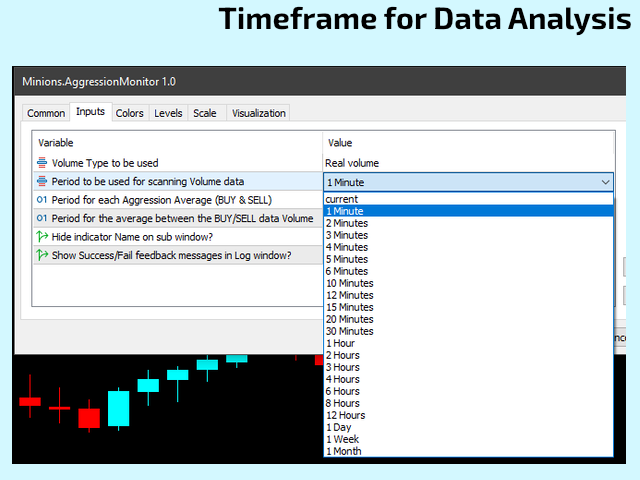
- Volume Type To Use - Real Volume or Tick Volume
- Period to be used for Scanning Volume Data - Choose your desired timeframe accordingly, ALWAYS Less than the current Timeframe being used. The smaller the Timeframe, the greater the granularity of the volume Data.
- Period for Each Aggression Average (BUY & SELL) - Moving average will be applied on the BUY and on the SELL side on the Volume histogram.
- Period for the Average Between the BUY/SELL Delta Volume - Choose the period for the Delta analysis.
- Hide Indicator Name on the Sub-Window?
- Show Success/Fail feedback messages in the Log Window (EXPERTS tab)
BUFFERS FOR YOUR EA
This indicator is EA Friendly, so please see below all the buffers available for you to use in your own EA:
- #0 - Volume raw data.
- #1 - Colors applied over the Histogram - NONE:0 / BUY below its average:1 / BUY above its average:2 / SELL below its average:3 / SELL above its average:4
- #2 - Moving average of the BUY side
- #3 - Moving average of the SELL side
- #4 - Moving average of the BUY/SELL Delta.
If you want to try this indicator on a Live or Demo account for FREE, see the instructions on our Blog: https://www.mql5.com/pt/blogs/post/747297 |
|---|
Didn't Find a Feature You Need?
No product is perfect for everyone. If you think you need a missing feature from our product just send us a message. We love feedback!
About Us
Flavio Jarabeck is the owner of MinionsLabs.com, an entrepreneurship focused on leveraging the knowledge and experience of professional traders through automated trading robots, freeing them to seek new opportunities and strategies in new markets and assets.
;)
