RSI Chart Levels
- Indicators
- Nikolay Mitrofanov
- Version: 1.1
- Updated: 21 December 2021
Enjoy!
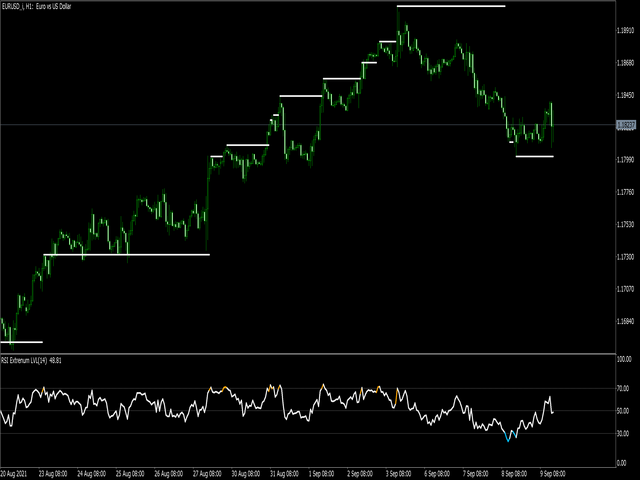
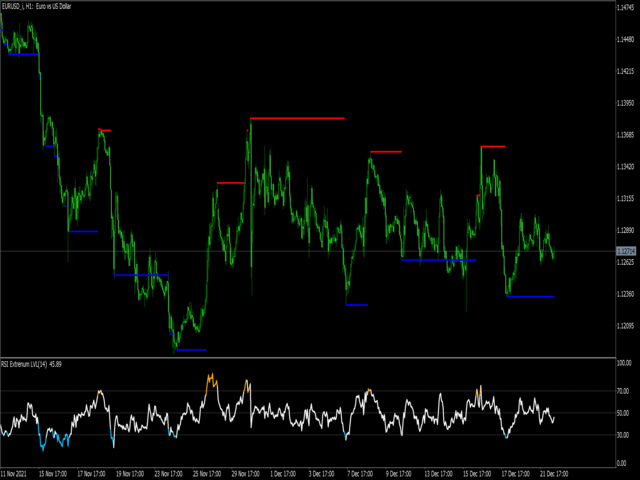
The first and third screenshots shows only overbought and oversold levels.
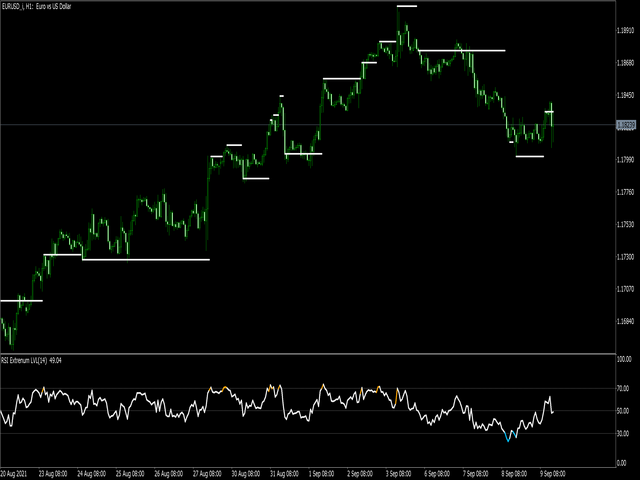
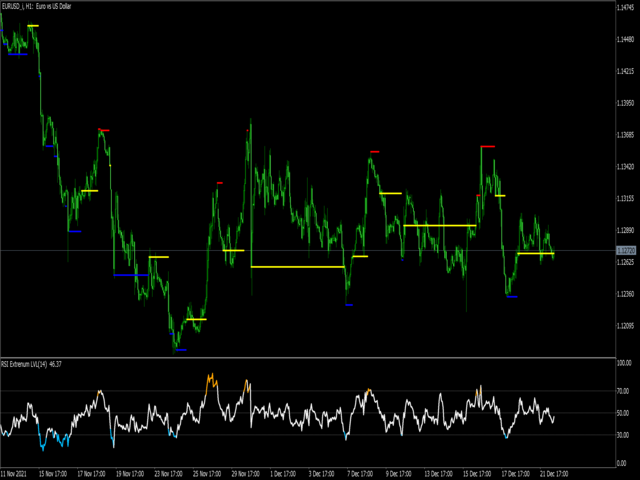
On the second and fourth - the same thing + the first crossing of 50% RSI.
RSI indicator at the bottom of the chart for clarity.







very good indicator