Cluster Viewer
- Utilities
- Marco Antonio Rodrigues
- Version: 1.5
- Updated: 21 November 2023
Limited time promotion!
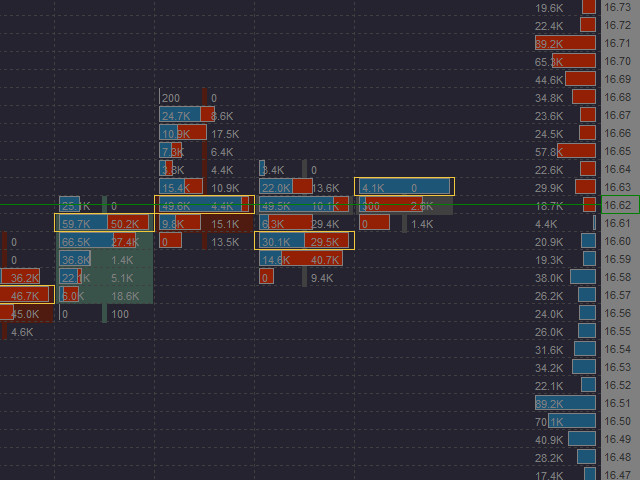
Within each candlestick is an epic fight between bears and bulls. Some pushing the price down and others forcing them up. Wouldn't it be great to be able to see where there is a greater concentration of business? Or to know if there is more buying or selling aggressions in the candlestick? After all, who is stronger, buyers or sellers?
Although a candlestick image has a lot of information, it is nevertheless weak for deeper analysis.
This is where you can count on the Cluster Viewer. This tool opens up a world of possibilities. The candle shows itself in all its nuances.
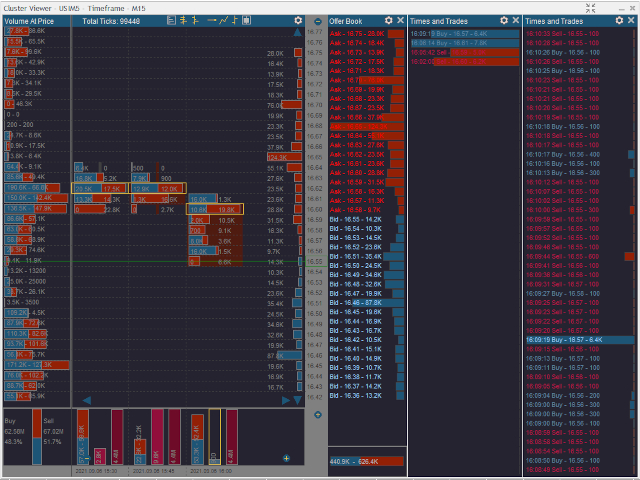
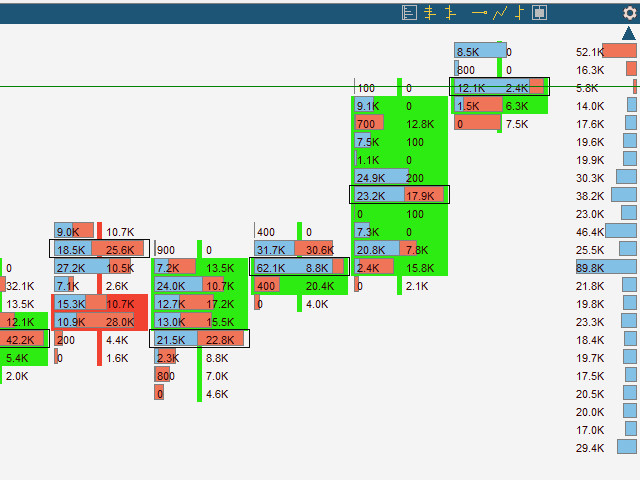
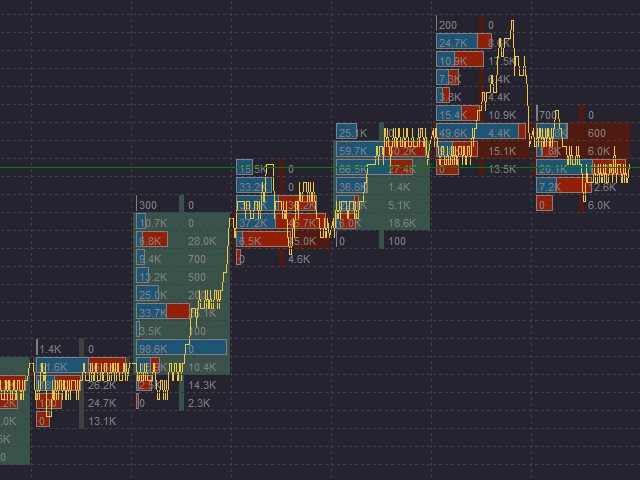
With Cluster Viewer you can quickly identify the price movement within each candlestick, making the trend more visible. In addition, you see buyer and seller volume by price range, which shows regions of support and resistance.
You will have two time and trade panels to put different filters and see high volume trades highlighted.
Furthermore, you can group trades by time, quantity of trades or by volume.
Cluster Viewer also shows:
• The difference between buy and sell aggressions within each candlestick (Delta).
• The accumulated delta of the last candlesticks.
• Delta divergence, that is, situations where the candlestick's direction (High or Low) diverges from the difference between buy and sell aggression.
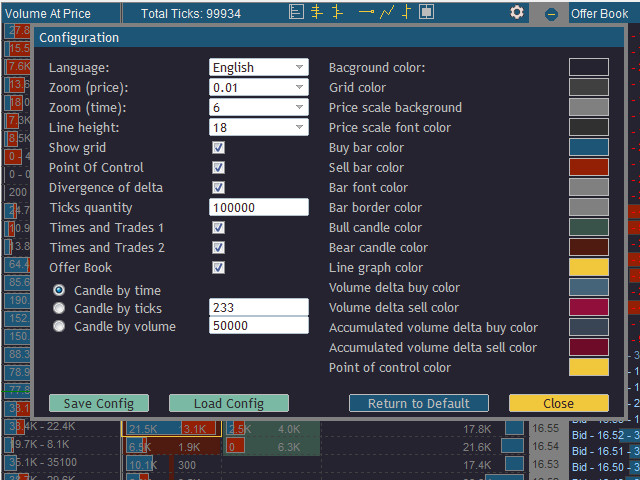
To feel more comfortable, you can set the interface colors to be more pleasing to your eyes.
You can even save settings in different files, one for each asset type.

























Efficient, fast, responsive, intuitive program. I like it a lot. Wonderful work.