AIS Activity Trading Sessions MT5
- Indicators
- Aleksej Poljakov
- Version: 1.0
- Activations: 5
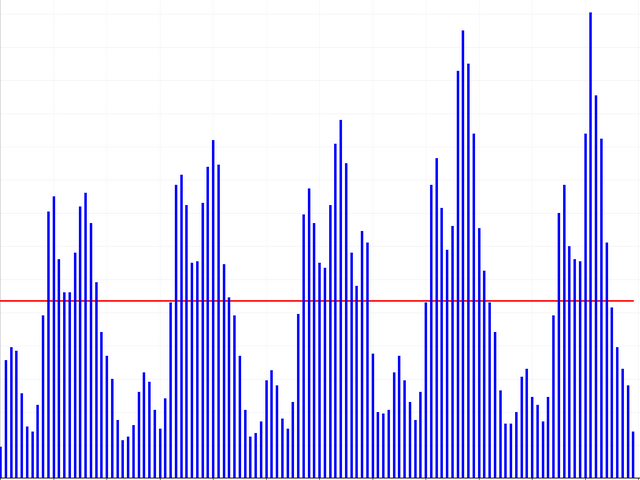
Some traders are guided by trading sessions during trading. Figure 1 shows the average price swing over one week. It can be seen that trading sessions on different days differ in their duration and activity.
This indicator is designed to estimate the average price movement at certain intervals within a weekly cycle. It takes into account price movements up and down separately from each other and makes it possible to determine the moments when high volatility is possible in the market.
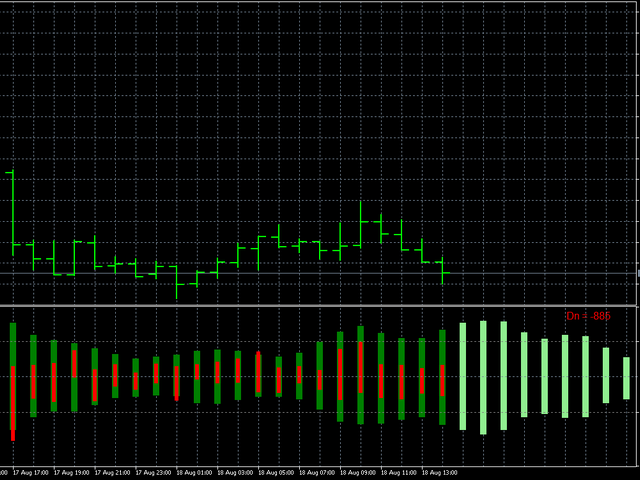
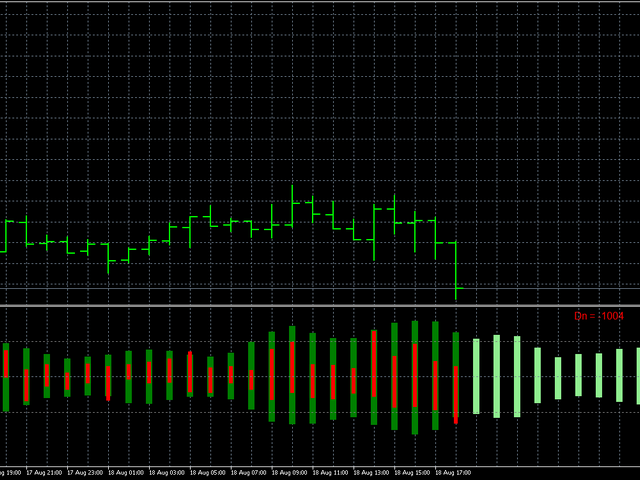
On the chart, the upward movement is shown above the midline, the downward movement is below the midline. The green histogram shows the average movement calculated from historical data. The red histogram shows the actual price movement. The accumulated difference between the price movement in points is additionally displayed in the upper right corner. The counter is reset to zero at the beginning of each week.
The indicator can work on all timeframes M1 - D1. All indicator settings relate to its appearance and do not affect its operation.
When working in real time, the indicator uses the available data from the symbol's chart. And when using the indicator in the strategy tester, it is necessary to enable it to accumulate statistical data on history.


Отличный индикатор!