Open close levels Metatrader 5
- Indicators
- Roman Utkin
- Version: 2.1
- Activations: 5
Open close levels.
Open close levels.
Open close levels - is an indicator for MetaTrader 5, which displays High/Low, Open/Close, ATR levels (set manually) of the day, week, month on the chart. Marks round levels, signs the days of the week, numbers every week. All levels are marked with price tags with a price symbol. Also, the indicator automatically calculates and displays on the chart the distance that the price has passed from High to Low and from Open to Close by day, week and month.
The indicator displays on the chart:
High/Low - displays High/Low of the day, week, month.
Open/Close - displays the Open/Close of the day, week, month.
Round levels - displays round levels (1.2000, 1.2100, 1.2200).
ATR - the indicator marks the ATR of the day, week, month. Indications are calculated manually from the opening price (day, week, month), based on how many points the price has passed from the opening price of the day on the nearest history! The indicator will mark 3 lines up and 3 down from the opening price (flat, moving day, strong moving day). A manual calculation was made in order to avoid incorrect readings that are given by indicators with automatic ATR calculation.
Price tags - each level that the indicator draws is indicated by a price tag in a four-digit format (1.2345).
Days of the week - marks the days of the week in the format Mo, Tu, We, Th, Fr. And also numbered every week (1,2,3,4).
Hotkeys - the hotkey function enables/disables the display of various indicator functions. For convenience, keyboard shortcuts are located on the Numpad keyboard:
1- High/Low.
2- Open/Close.
3- Round levels.
4- ATR.
5- Price tags.
6- Days of the week and the distance the price has passed from Min to Max and from Open to Close.
0- Disable everything.
Advantages of the indicator:
- Saves a lot of time that you spend on graphing. Unlike other indicators, indicator lines are drawn strictly from the beginning of the day, week, month to the end in the form of a segment, which gives a clear understanding of which level is displayed in front of you.
- You no longer need to manually calculate how much the price has passed from opening to closing, from minimum to maximum, think what day of the week it is.
- The hotkey function enables, disables the display of the levels that you need and completely removes all markup from the chart with one click of a key so as not to interfere with the reading of the price chart.A large number of settings to help customize the indicator to your taste and color.
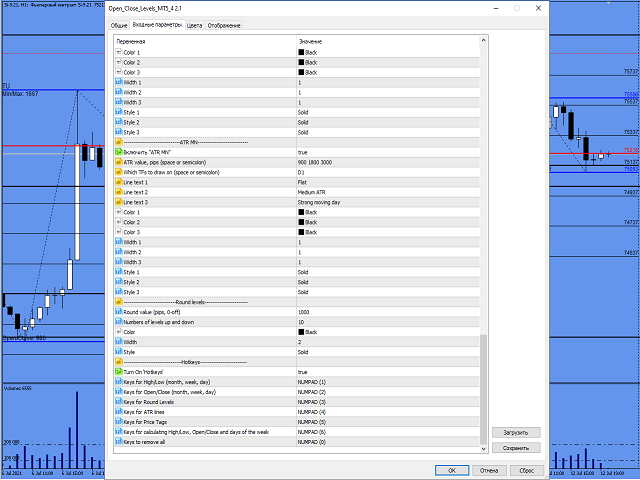
Indicator Settings:
- Number of bars to calculate - the number of candles by which the indicator will calculate data.
- D1 Open/Close, High/Low - display settings for High/Low of the day and Open/Close of the day.
- W1 Open/Close, High/Low - display settings for High/Low weeks and Open/Close of the week.
- MN Open/Close, High Low - display settings for High/Low of the month and Open/Close of the month.
- Calculation High/Low - turns on and off the display of the distance that the price has passed from High to Low for a day, week, month.
- Calculation Open/Close - turns on and off the display of the distance that the price has passed from Open to Close for a day, week, month.
- Days of the week - turns on/off the display of days of the week.
- Week number - turns on/off the display of the numbering of weeks.
- ATR D1 - ATR day settings.
- ATR W1 - ATR week settings.
- ATR MN - ATR month settings.
- Round levels - display settings for round levels.
- Hotkeys - settings for displaying hotkeys.
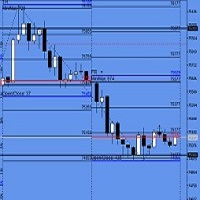
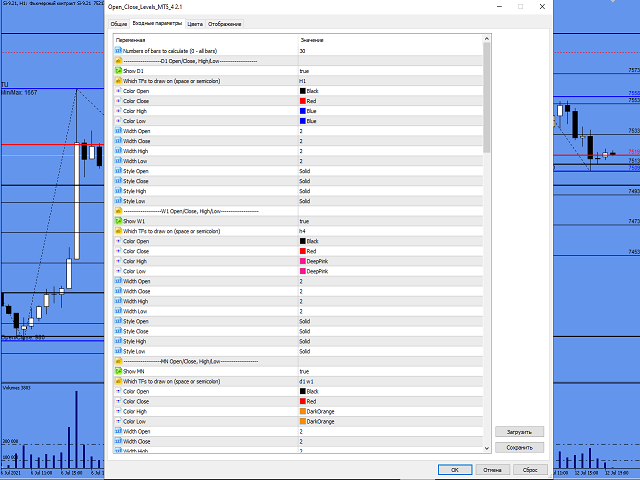
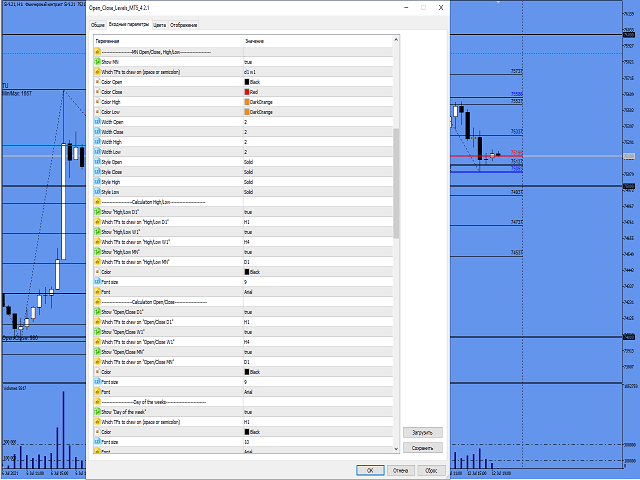
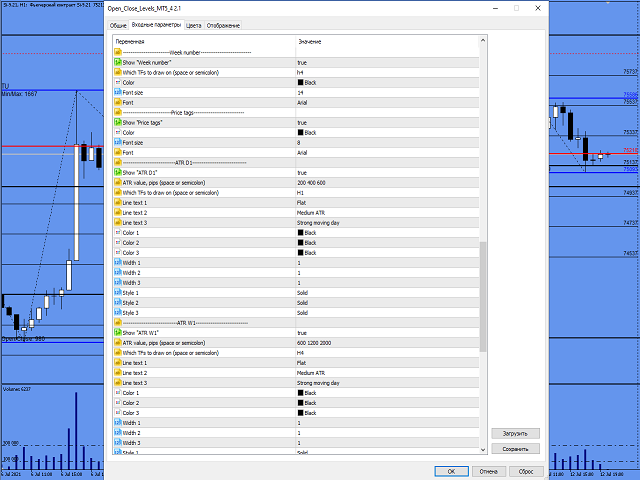





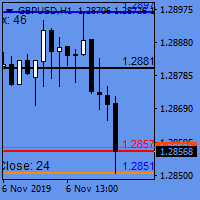
Very configurable indicator to allow the display of the highs and lows as well as the open and close of day, week, month and these highs and lows can be configured to show on the timeframes of your choice. With a little simple configuration then this tool can be set up to allow greater clarity of how the market is forming.