Rsi Style
- Indicators
- Javier Morales Fernandez
- Version: 1.0
Because style matters
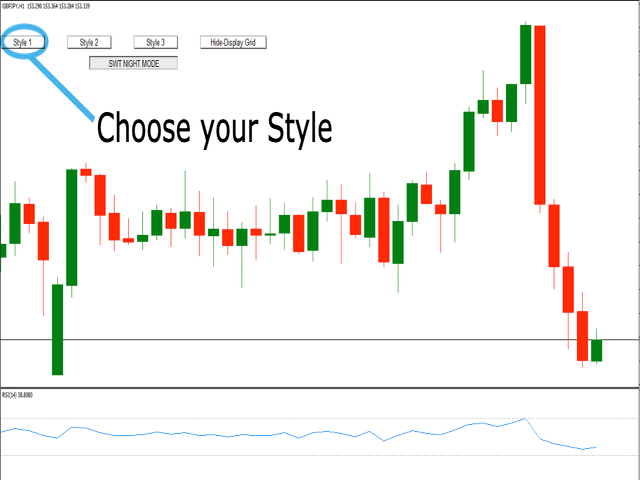
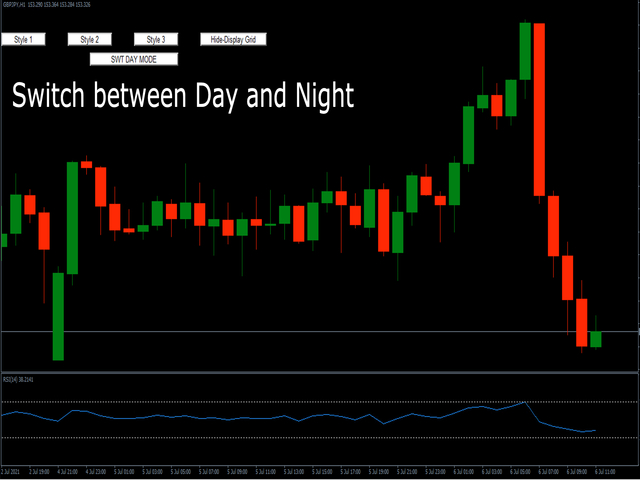
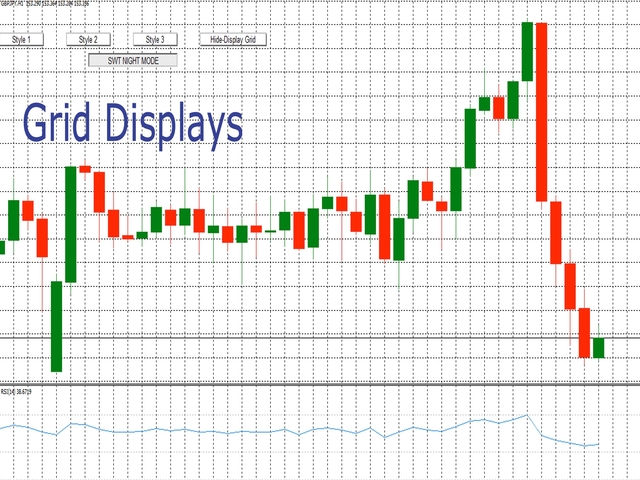
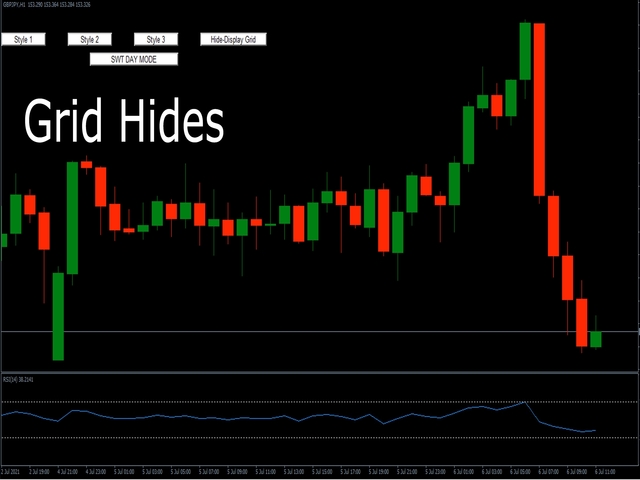
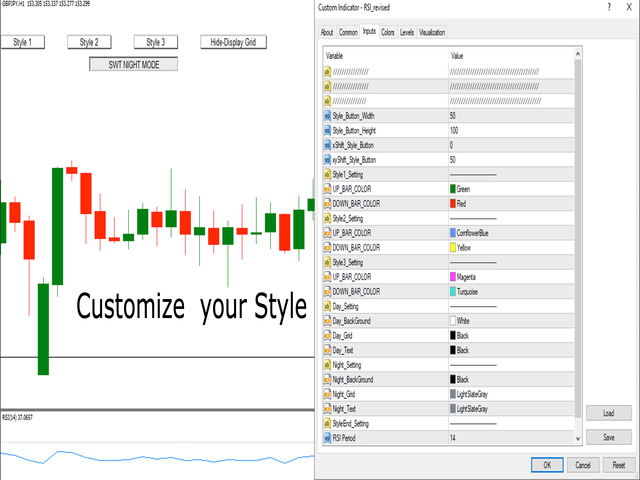
I know how annoying it is to click properties every time to change the candle’s color, the background to light or dark, and put or remove the grid. Here is the solution with one click:
- Three customizable buttons to choose the candle style that traders want.
- One button to switch between Day and Night mode.
- One button to show or hide the Grid on the charts.
*****On the settings, you can choose where the buttons should be displayed on the screen*****
Please consider checking my other products https://www.mql5.com/en/users/javimorales.fer/seller
Check MT5 VERSION: https://www.mql5.com/en/market/product/69070
What is the RSI indicator?
The RSI is displayed as an oscillator that can measure from 0 to 100. The indicator was developed by J. Welles Wilder Jr. and published in his seminal 1978 book, “New Concepts in Technical Trading Systems.” It was considered oversold below 20 and overbought above 80. The RSI provides signals that tell traders to buy when the currency/stock/instrument is oversold and sell when it is overbought.
Feel free to contact me with any questions.
Author
Javier Morales, founder of Algorithms for Trading.

