Forex Market Profile and Vwap
- Indicators
- Lorentzos Roussos
- Version: 1.1
- Updated: 19 November 2022
Volume Profile Indicator / Market Profile Indicator
What this is not :
FMP is not the classic letter-coded TPO display , does not display the overall chart data profile calculation , and , it does not segment the chart into periods and calculate them.
What it does :
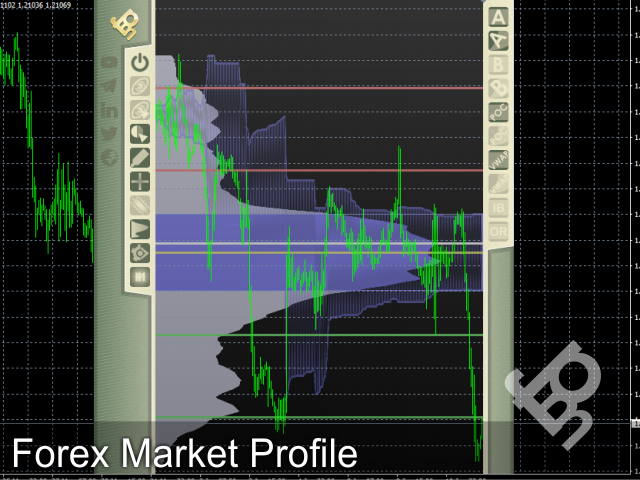
- Most importantly ,the FMP indicator will process data that resides between the left edge of the user defined spectrum and the right edge of the user defined spectrum.
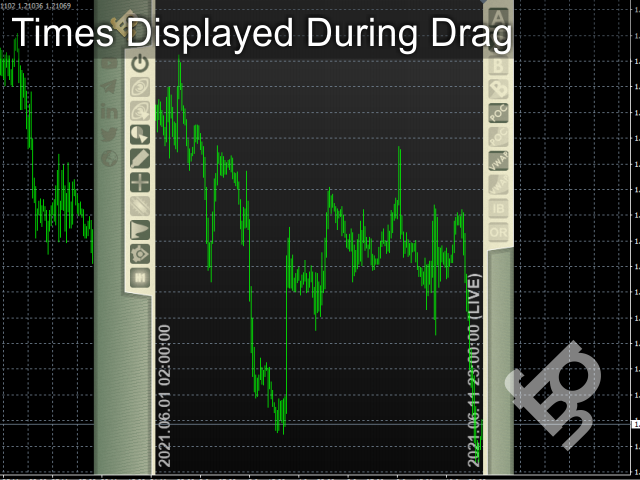
- User can define the spectrum by just pulling each end of the indicator with the mouse.
- When the indicators right edge is pulled to the live bar and further (to the future) then the indicator is considered “live” (it updates with new bars)
- The indicator drops an “anchor” object on the chart it is attached to ,and subsequently associates that anchor with a file on the hard drive.
- This allows you to have an ongoing FMP running on a chart ,with your settings persisting through restarts until the chart –or the indicator- is closed.
- The FMP indicator can run many instances of itself on one chart and you are given the ability to name them .(the name appears semi transparent over the indicator data for you to be able to tell them apart)
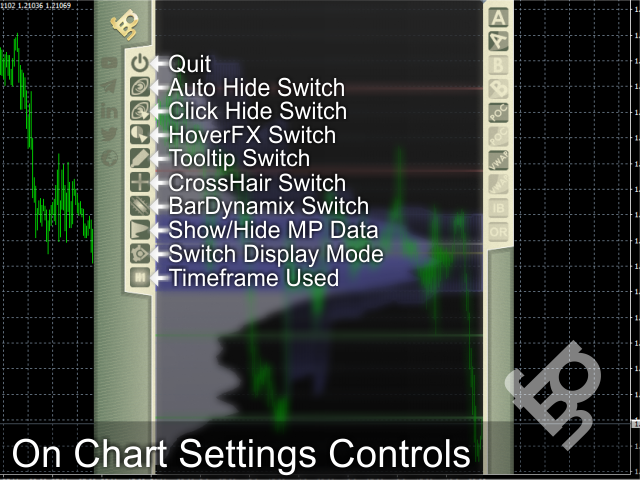
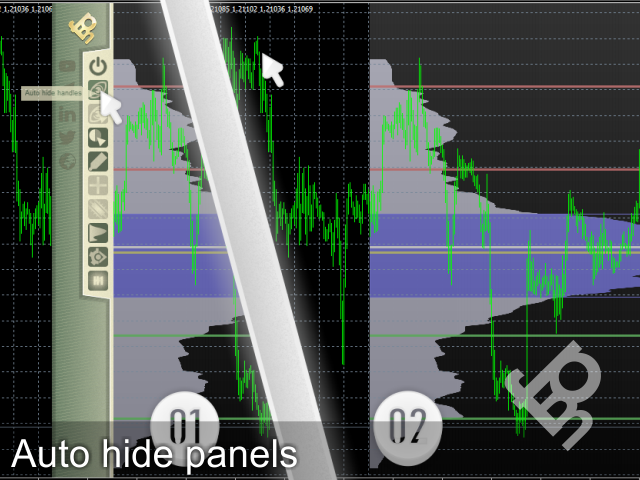
- The indicator’s data window is surrounded by quick toggle controls which update the “memory” of settings for the indicator for that chart when their state changes.
- The left handle , the right handle and the data window’s display can be customized . You can select from 13 different style combinations ,or pick each part’s individual style (out of the 13).
- You can opt to display the profile (tpos) data aligned to the left of the spectrum ,symmetrically centered in the middle ,aligned to the right of the spectrum .
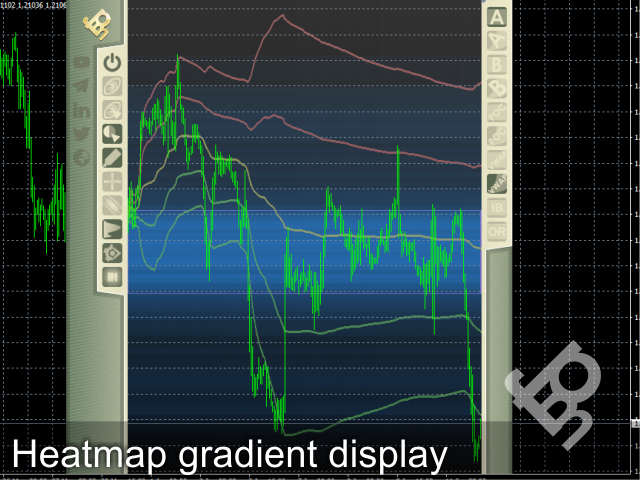
- Theres an additional “Heatmap” display mode ,and a “no display” which allows for other metrics to be prominent in the data window.
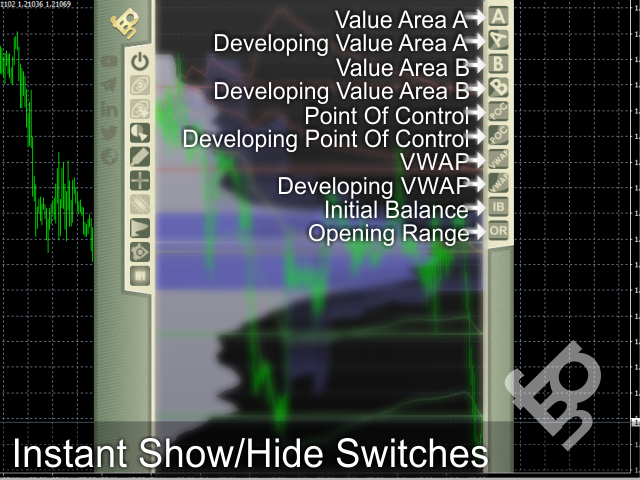
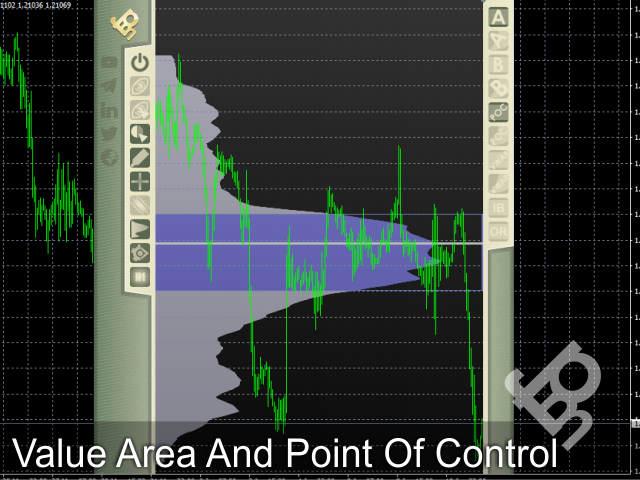
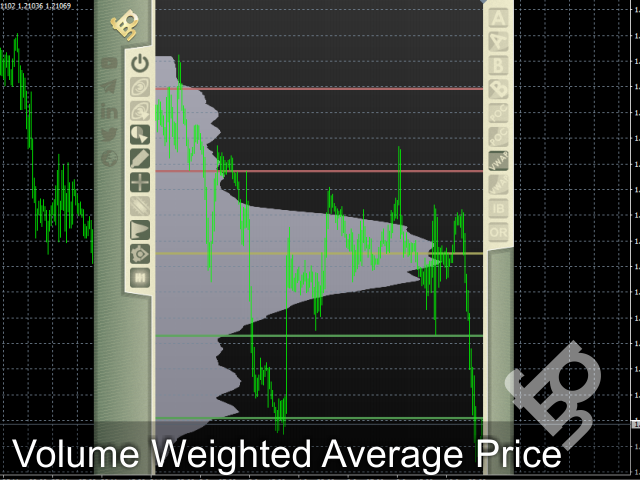
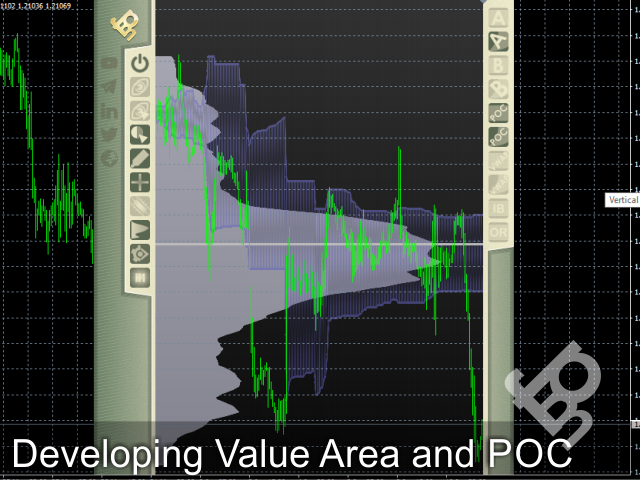
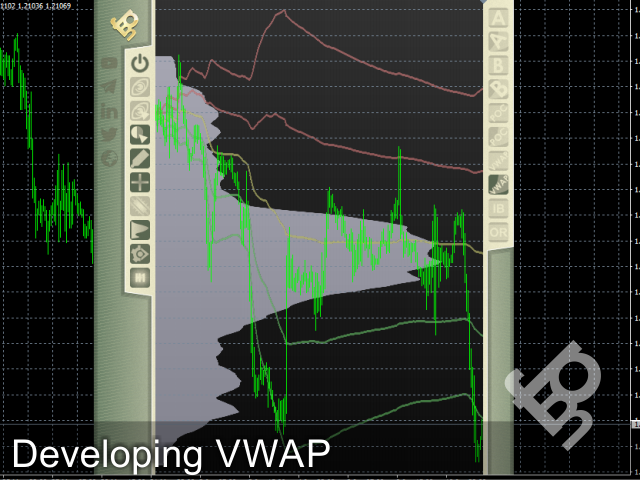
In addition it offers 2 value area calculations and the ability to adjust the "activity" percentage that each one represents , a point of control calculation ,the volume weighted average price calculation (VWAP) , the initial balance , the opening range , the developing point of control (DevPOC) as it evolves through the range as well as the developing value areas and the developing VWAP.
*Developing metrics track how one data point evolved through the spectrum you have defined over time to arrive at the level it currently is*
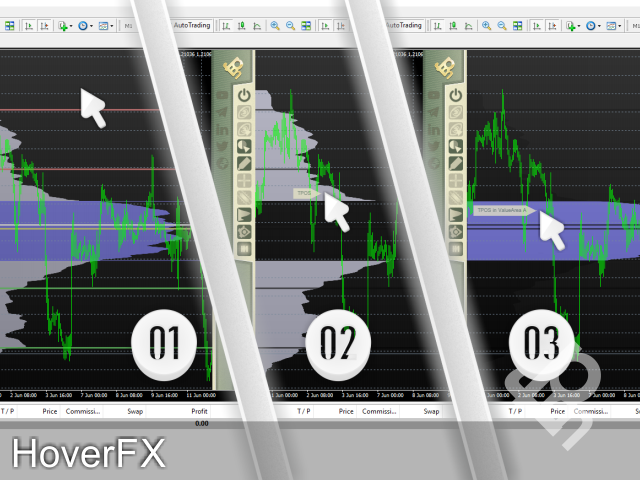
To avoid clutter FMP has a hover functionality which enhances the data point your mouse is tracking over versus the other data points that occupy the Data display window.(There are quick switches to toggle this on and off)
For similar reasons ,a tooltip system has been introduced (only in the English language for now ,this also can be toggled on and off) and a crosshair over the data display window that displays price and time.(You can switch this on and off as well)
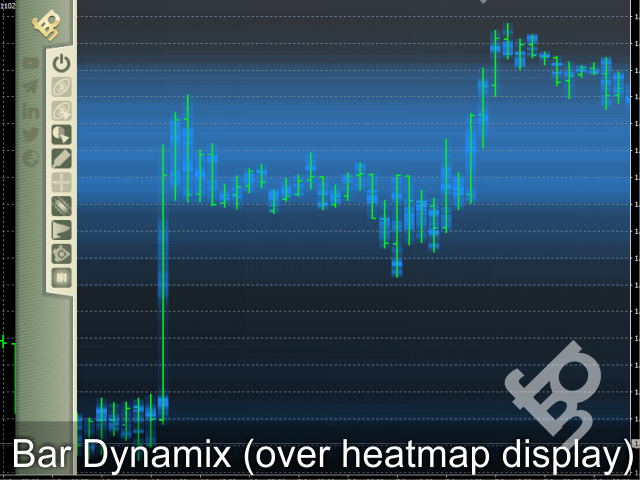
BarDynamix (Experimental portion of the FMP indicator) ,essentially it’s a market profile inside a market profile.It will run the same calculation and plot a gradient map of the areas with the most activity for each bar (candle) inside the range you have specified.(you can switch its display on and off.It has been optimized to “burn” as little resources as possible when on)
You can read an extensive manual here
The indicator does not use :
- AI , artificial intelligence
- chatGPT , claude , deepseek
- neural network
- reinforcement learning
- genetic algorithm
- OpenAI







please tell me why it keep removed from chart