DveMashki
- Indicators
- Iurii Tokman
- Version: 1.0
- Activations: 5
DveMashki Indicator: A Tool for Identifying Trends and Sideways Markets
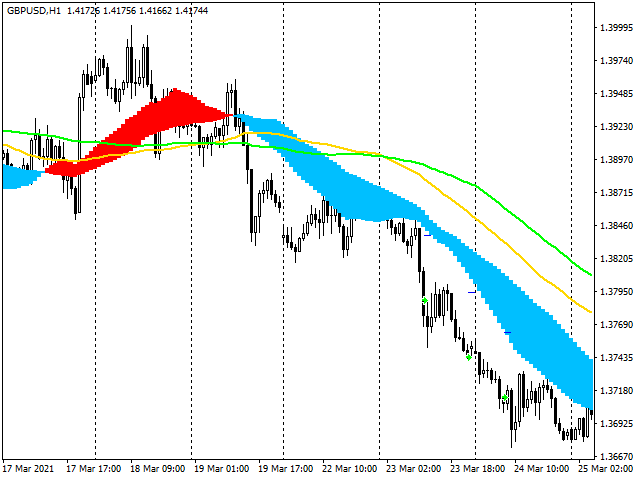
The DveMashki indicator is a powerful tool for analyzing market trends and detecting flat or consolidation phases in price movement. Based on moving averages, this indicator allows traders to visually assess the current trend and its strength, as well as recognize quieter, consolidating phases. This can be especially helpful for selecting the most suitable trading strategy based on market conditions.
Features and Uses of the DveMashki Indicator
The DveMashki indicator is suitable for use in both trending and flat (sideways) markets, signaling the start and end of trending phases. It helps traders avoid trading during low volatility periods and provides signals to enter a position when a confirmed movement appears. Its flexible settings allow it to be adapted to various timeframes and trading styles.
Indicator Settings Explained
-
MaPeriod1 - First Moving Average Period Sets the period for the first moving average, which identifies short-term trends. Lower values make the indicator more sensitive to price changes.
-
MaPeriod2 - Second Moving Average Period Defines the period for the second moving average, generally larger than MaPeriod1, to reflect longer-term trends. The combination of these two periods helps identify crossover points, which can indicate a potential change in direction.
-
MaMethod - Averaging Method Allows you to select the method for calculating moving averages:
- MODE_SMA - Simple Moving Average, which smooths out fluctuations over the selected period.
- MODE_EMA - Exponential Moving Average, which gives more weight to recent data, making it more responsive to price changes.
- MODE_SMMA - Smoothed Moving Average, designed to reduce sudden fluctuations.
- MODE_LWMA - Linear Weighted Moving Average, which emphasizes the latest prices in the calculation.
-
MaPrice - Price Type for Averaging Lets you select the reference price for calculation:
- PRICE_CLOSE - Closing price (default).
- PRICE_OPEN - Opening price.
- PRICE_HIGH and PRICE_LOW - Highest and lowest prices for the period.
- PRICE_MEDIAN - Median price, calculated as (high+low)/2.
- PRICE_TYPICAL - Typical price, calculated as (high+low+close)/3.
- PRICE_WEIGHTED - Weighted close price, using a weighted formula: (high+low+close+close)/4.
-
MaPeriod3 - Third Moving Average Period Used for additional trend calculations or to add long-term filters depending on the trading strategy.
-
MaPeriod4 - Fourth Moving Average Period Helps analyze and track even longer-term trends, adding extra depth to the analysis.
Using the DveMashki Indicator in Trading
- For Trend Strategies: When faster moving averages cross over slower ones, the indicator signals a new trend direction. During flat periods, the indicator displays small fluctuations, indicating that opening active trades could be risky. The values chosen for MaPeriod1 and MaPeriod2 can be fine-tuned for intraday trading on short timeframes or long-term positions on higher timeframes.
Using the DveMashki Indicator in Trend and Sideways Markets
Using the Indicator in Trends
-
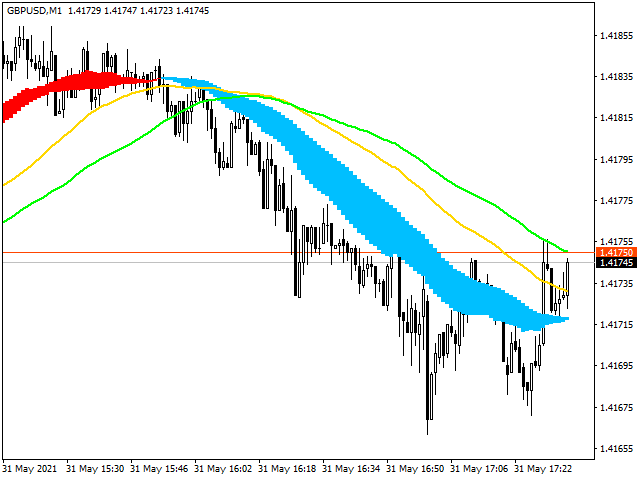
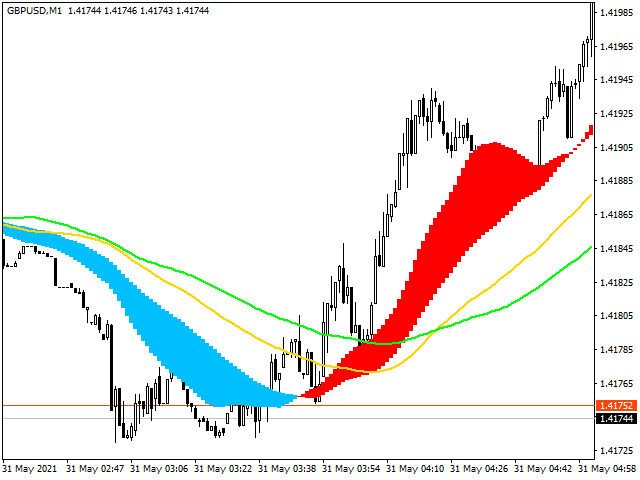
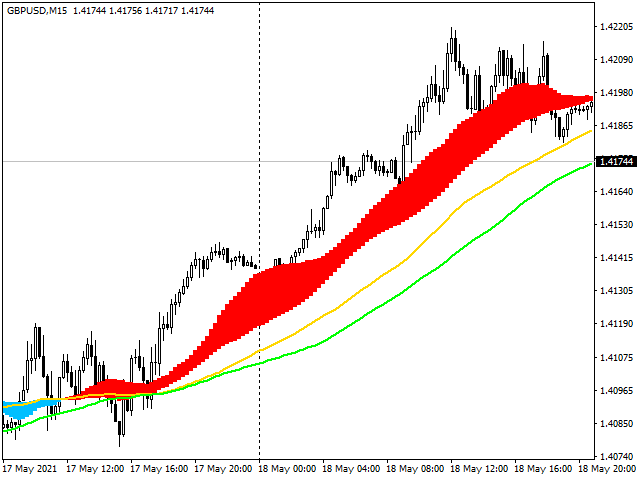
Uptrend (Bullish Market) When MaPeriod1 crosses above MaPeriod2, the indicator signals the start of an uptrend. This is a good signal for buying (going long). A steeper upward slope indicates a stronger bullish trend, and traders may add to their positions.
-
Downtrend (Bearish Market) When MaPeriod1 crosses below MaPeriod2, the indicator signals a downtrend, suggesting a sell (short position). A downward slope confirms the strength of the bearish trend.
Using the Indicator in Sideways Markets
-
Identifying Flat Markets Frequent crossovers or nearly horizontal lines indicate a flat market phase where price lacks direction, signaling potential consolidation. Trading during these times may involve higher risk.
-
Avoiding False Signals Flat zones often feature false breakouts when price temporarily moves outside the consolidation range before returning. The indicator helps identify areas where it is better to avoid new trades.
Examples
- Trending Market: If the selected indicator periods (such as MaPeriod1 and MaPeriod2) show a crossover in one direction with diverging lines, this can indicate an entry opportunity in the direction of the trend.
- Sideways Market: In cases where the lines cross frequently and move horizontally, traders may want to avoid trading and wait for a confirmed trend signal to minimize risk.
General Tips
- Adjust averaging periods and the moving average calculation method according to your trading style (shorter periods for active trading, longer for position trading).
- Choose the price type (MaPrice) carefully—for precise analysis, select closing price (PRICE_CLOSE) or typical price (PRICE_TYPICAL) for a smoother analysis.
- Use DveMashki in conjunction with other indicators (e.g., volume) for trend confirmation.
Conclusion: DveMashki is a useful indicator for identifying strong directional moves and avoiding trading during consolidation phases, which is especially valuable for traders focusing on trend-based strategies.
