MACDwithColoredDiffHistogram
- Indicators
- Guan Hua He
- Version: 1.0
- Activations: 20
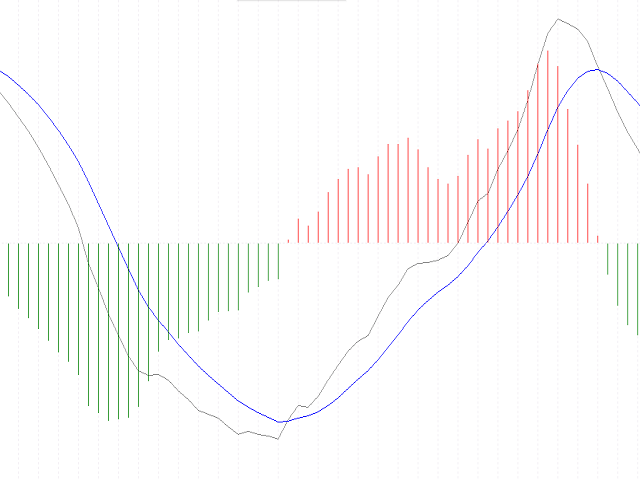
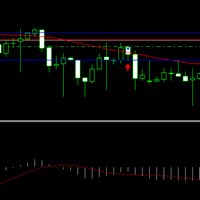
The Macd Signal with DIF line, DEA line and colored Macd Histogram.
The Moving Average Convergence Divergence Indicator (MACD) is both a trend–seeking and momentum indicator which uses several exponential moving averages set to closing prices to generate trading signals.
The Gray Line is the DIF line.
The Blue Line is the DEA line.
Version 2.0:
New features are added:
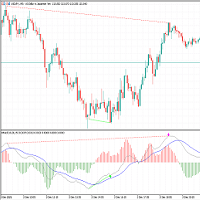
The indicator can show Classical bearish divergence, Classical bullish divergence, Reverse bearish divergence and Reverse bullish divergence now.
When divergence occurred, the indicator will draw divergence line on both main window and indicator window, and show the alter message.
Version 1.0:
The colored Macd Histogram is the diff of DIF and DEA line.
If DIF is larger than DEA, the Macd Histogram colored Red, and is larger than 0.
If DIF is smaller than DEA, the Macd Histogram colored Green, and is smaller than 0.Try it, and pm me if you have any question.
