TheStrat FTFC MT5
- Indicators
- Robert Gerald Wood
- Version: 1.2
- Updated: 16 June 2021
- Activations: 5
FTFC refers to Full Timeframe Continuity as defined by Rob Smith's The Strat .
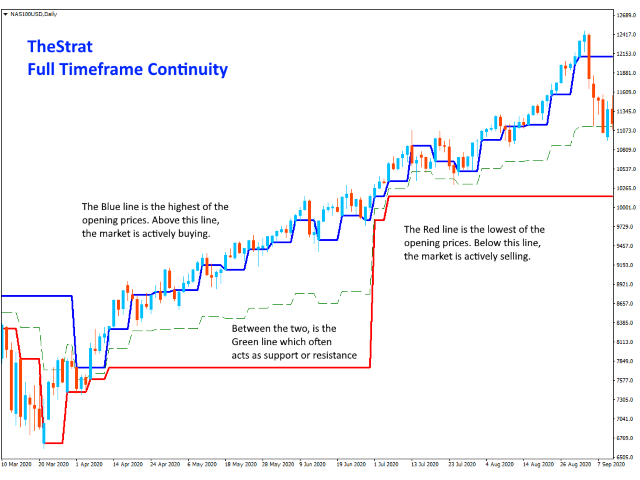
This indicator draws two lines on the chart, one of the highest of the Quarterly, Monthly, Weekly, Daily or Hourly opening levels, and the second of the lowest of those values. This gives you a channel above or below which trading is more likely to be very strongly in one direction. Between the lines, price action will be choppier and you may with to use wider stops.
A third dashed line is also drawn to show the mid point between the higs and lows. This is often a good place to find support or resistance as the market tries to push price in a certain direction. This line can be turned off if you choose by setting the colour to NONE.
SETTINGS
IncludeQuarterlyLevel
Allows you to choose to include the Quarterly open price in the calculation as some people prefer to ignore it.
IncludeCurrentTimeframeOpen
When true, if the currently displayed timeframe is H1, D1, W1 or MN1, the indicator will include that periods open in its calculation. This is a new setting in the latest version of the indicator. Previously, the calculation did NOT include the current time period open, and this does not agree with TheStrat.
The setting is false by default, so existing users are unaffected unless they choose to turn it on.
MaxMilliSecondsToCalculate
For charts with a lot of history loaded (over 10,000 bars), this will limit the amount of time the indicator has to initialise. By default, the setting is 1500 milliseconds, which is 1.5 seconds. If the indicator has not managed to perform all its calculations for historical bars after that period, it will stop trying. This means you will always get a significant history, but be guaranteed that it does not cause your chart to stop.


