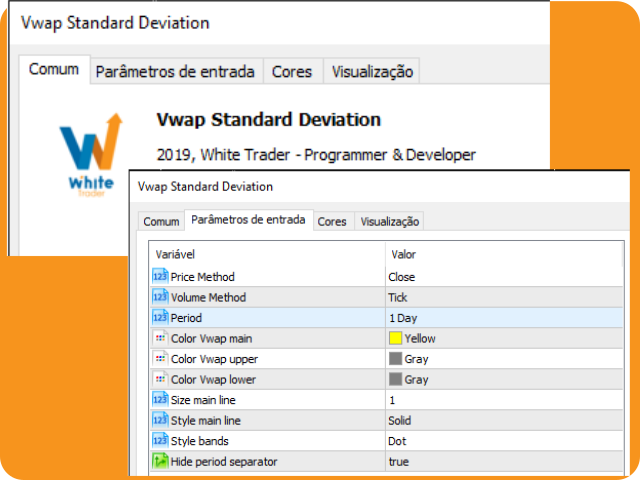
Vwap Standard Deviation
- Indicators
- Ricardo Almeida Branco
- Version: 1.0
- Activations: 5
O indicador Vwap Deviation Bands segue na mesma linha dos outros indicadores da White Trader, que buscam leveza, personalização e qualidade, para entregar o que há de melhor para o trader.
Isto, além de combinar preço e volume (informações importantes para o trader) com uma medida estatística do desvio padrão.
Este indicador já foi utilizado e testado por outros traders que deram sugestões, inclusive, para chegarmos nesta versão final (embora ainda esteja aceitando sugestões, sempre :) ).
O desvio padrãoé uma medida que mostra o grau de dispersão de um conjunto de dados.
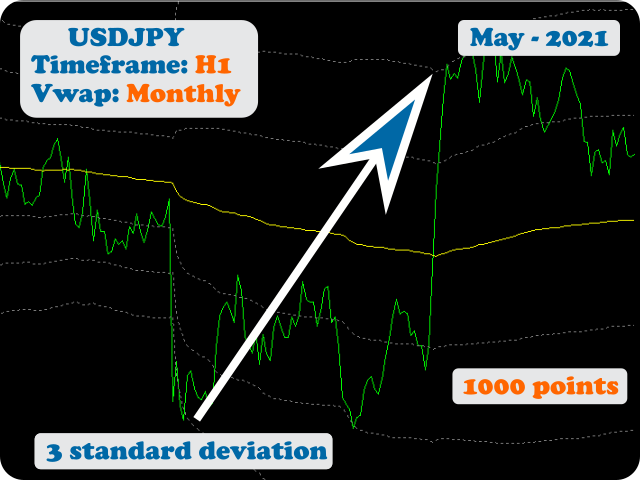
Se a distribuição é normal (ou aproximadamente normal) cerca de 99,7% das vezes os valores estão dentro de 3 desvios padrão.
Mesmo sabendo que o mercado financeiro é aleatório, baixe o indicador e veja por você mesmo quantas vezes o preço fica fora dessa faixa.
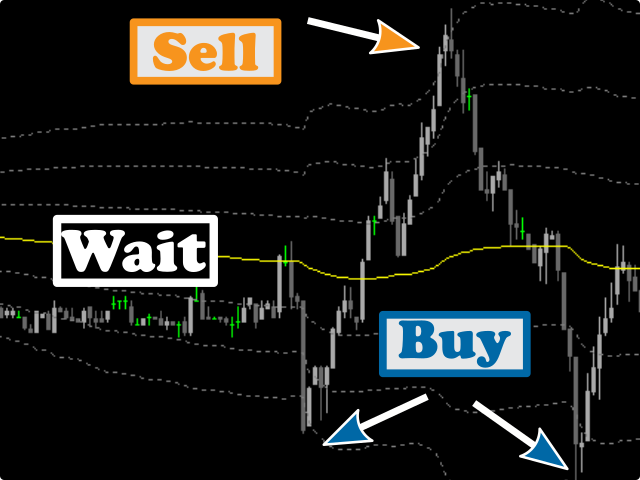
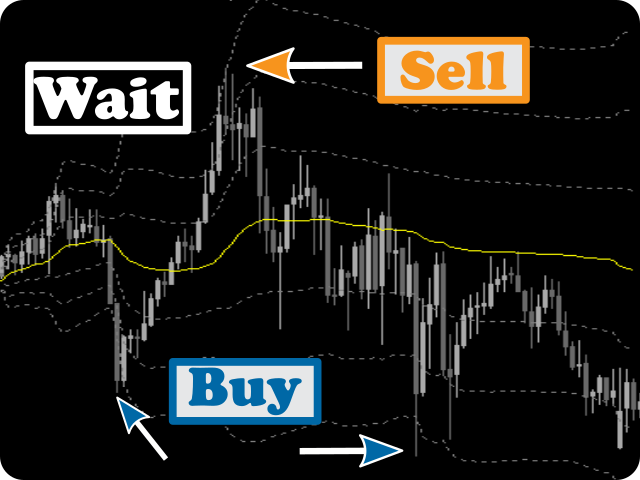
Claro que ainda fica o aviso que o preço pode continuar andando contra sua posição, mas dentro desta banda de 3 desvios padrão. Então cabe ao trader analisar se o indicador lhe é útil, podendo somar ao seu operacional.
O uso do desvio padrão foi estudado no livro MIDAS Technical Analysis (no livro a aplicação foi na Midas - e é um indicador que a White Trader também já produziu).
O indicador Vwap Standard Deviation pode ser facilmente utilizado em EAsatráves das funções iCustom + CopyBuffer (ver imagem anexo com número dos buffers).
Dúvidas ou sugestões, por favor me envia uma mensagem privada aqui mesmo pelo site do mql5.
Sucesso e bons trades!