• Overview
  • Reviews (6)
  • Comments (6)
  • What's new

Chart Drawing Cloner

5

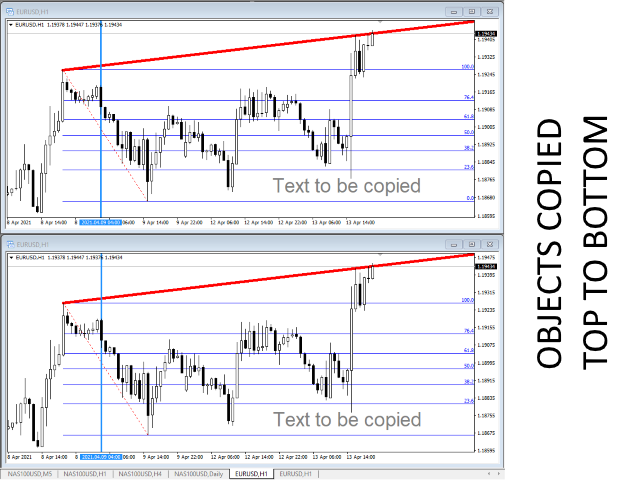
This Script allows you to copy drawing objects of any type, like trend lines, Fibonachi Retracements etc, to one or more other charts.


By default, the script will copy all the objects on the current chart, that is the chart the script was applied to, to any other chart of the same Symbol currently loaded.


Settings

DestinationTimeframe

When set to anything other than PERIOD_CURRENT, then it will copy the objects to any open chart of the same Symbol as the chart the script was applied to.

If you set the value to a specific timeframe, say PERIOD_D1, then only charts of the same Symbol AND period will be updated.

CopyObjectsOfType

You can set this to a specific type of object you wish to copy, then only objects of that type will be copied to other charts.

CopyIndicatorWindowObjects

When set to True, objects on Indicator windows will also be copied. This rely's on the second chart having the same indicators as the source chart, and in the same order.


Duplicate objects between charts to your hearts content!


Reviews 6
crivelazquez
15
crivelazquez 2024.08.20 04:41 
 

excelente tank very muchexcelente tank very much

Kedrov
597
Kedrov 2024.08.03 10:52 
 

Hi! It works great! Thank you! Good luck!

Recommended products
Auto Fibo Pro m
DMITRII GRIDASOV
"Auto FIBO Pro"   Crypto_Forex  indicator  - is great auxiliary tool in trading! Indicator automatically calculate and place on chart Fibo levels and local trend lines (red color). Fibonacci levels indicate key areas where price can reverse. Most important levels are 23.6%, 38.2%, 50% and 61.8%. You can use it   for reversal scalping  or for zone grid trading. There are plenty of opportunities to  improve your current system using Auto FIBO Pro indicator as well. It has Info Spread Swap Displa
One of the number sequences is called "Forest Fire Sequence". It has been recognized as one of the most beautiful new sequences. Its main feature is that this sequence avoids linear trends, even the shortest ones. It is this property that formed the basis of this indicator. When analyzing a financial time series, this indicator tries to reject all possible trend options. And only if he fails, then he recognizes the presence of a trend and gives the appropriate signal. This approach allows one t
VR Cub
Vladimir Pastushak
VR Cub is an indicator for getting high-quality entry points. The indicator was developed to facilitate mathematical calculations and simplify the search for entry points into a position. The trading strategy for which the indicator was written has been proving its effectiveness for many years. The simplicity of the trading strategy is its great advantage, which allows even novice traders to successfully trade with it. VR Cub calculates position opening points and Take Profit and Stop Loss targe
Trendiness Index
Libertas LLC
5 (3)
"The trend is your friend" is one of the best known sayings in investing, because capturing large trendy price movements can be extremely profitable. However, trading with the trend is often easier said than done, because many indicators are based on price reversals not trends. These aren't very effective at identifying trendy periods, or predicting whether trends will continue. We developed the Trendiness Index to help address this problem by indicating the strength and direction of price trend
Trend Ray
Andriy Sydoruk
The indicator shows the potential trend direction by cyclical-wave dependence. Thus, all the rays of the intersection will be optimal rays, in the direction of which the price is expected to move, taking into account the indicator period. Rays can be used as a direction for potential market movement. But we must not forget that the approach must be comprehensive, the indicator signals require additional information to enter the market.
Bigger chart labels would allow the user to be entirely aware of which chart he/she is on. Each chart window is unique, containing different patterns and economic motives so acknowledging the chart window would be absolutely essential! There are well known Economic Time Zones included in clear view, by choice!    Simple does it! Use your computing mouse scroller, clicking with the right finger on the label, in order to customize the label properties. From there, choose your preferred color, fon
FREE
Awesome Oscillator by Bill Williams with the ability to fine-tune and replace the averaging algorithms of the indicator, which significantly expands the possibilities of using this oscillator in algorithmic trading and brings it closer in its properties to such an indicator as the MACD. To reduce price noise, the final indicator is processed with an additional Smooth averaging. The indicator has the ability to give alerts, send mail messages and push signals when the direction of movement of th
Big Trend Signal   indicator is designed for trend and signal trading. This indicator generates trend signals.  It uses many algorithms and indicators to generate this signal. It tries to generate a signal from the points with the highest trend potential. This indicator is a complete trading product. This indicator does not need any additional indicators.  You can only trade with this indicator. The generated signals are displayed on the graphical screen.  Thanks to the alert features you can ge
Trend Catcher with Alert
Issam Kassas
4.68 (63)
The Trend Catcher: The Trend Catcher Strategy with Alert Indicator is a versatile technical analysis tool that aids traders in identifying market trends and potential entry and exit points. It features a dynamic Trend Catcher Strategy , adapting to market conditions for a clear visual representation of trend direction. Traders can customize parameters to align with their preferences and risk tolerance. The indicator assists in trend identification, signals potential reversals, serves as a trail
FREE
Close by percentage MT4
Konstantin Kulikov
4.88 (8)
Hello friends. I wrote this utility specifically for use in my profile with a large number of Expert Advisors and sets ("Joint_profiles_from_grid_sets" https://www.mql5.com/en/blogs/post/747929 ). Now, in order to limit losses on the account, there is no need to change the "Close_positions_at_percentage_of_loss" parameter on each chart. Just open one additional chart, attach this utility and set the desired percentage for closing all trades on the account. The utility has the following function
FREE
Gvs Undefeated Trend   indicator is designed for trend and signal trading. This indicator generates trend signals.  It uses many algorithms and indicators to generate this signal. It tries to generate a signal from the points with the highest trend potential. This indicator is a complete trading product. This indicator does not need any additional indicators.  You can only trade with this indicator. The generated signals are displayed on the graphical screen.  Thanks to the alert features you ca
Description:  For a comprehensive understanding of our indicators, we invite you to explore the entire Q&A section within this MQL5 blog post   here . The "Currency Strength Meter Strategy" Indicator is a cutting-edge technical analysis tool that offers traders a unique perspective on the forex market. By analyzing the relative strength of different currencies, this indicator provides valuable insights into the market's dynamics, allowing traders to make informed decisions. Understanding Curren
This    Perfective Signal System   indicator is designed for signal trading. This indicator generates trend signals. It uses many algorithms and indicators to generate this signal. It tries to generate a signal from the points with the highest trend potential. This indicator is a complete trading product. This indicator does not need any additional indicators. The indicator certainly does not repaint. The point at which the signal is given does not change.     Features and Suggestions Time
The Arrow Scalper
Fawwaz Abdulmantaser Salim Albaker
1 (2)
Dear Friend..  I share with you this simple Expert Adviser .. it is full automatic  this Expert Adviser following the trend of the pair you install on or any stocks or indices , it is works like that: - when the trend on H4 chart show a start of up trend the expert will wait till the 15M & 1H charts show an up trend the EA will open a buy order directly , and do the same for down trend and open a sell order the buy or sell  order lot size and take profit and stop loss will measured manually  by
FREE
Description:  For a comprehensive understanding of our indicators, we invite you to explore the entire Q&A section within this MQL5 blog post   here . The "Divergence Strategy Indicator" is an advanced technical analysis tool designed to identify potential trend reversals and trend continuation opportunities in the market. It leverages the concept of divergence, a powerful phenomenon that occurs when price action diverges from an oscillator, indicating underlying shifts in market sentiment. Spo
Alpha Trend sign has been a very popular trading tool in our company for a long time. It can verify our trading system and clearly indicate trading signals, and the signals will not drift. Main functions: Based on the market display of active areas, indicators can be used to intuitively determine whether the current market trend belongs to a trend market or a volatile market. And enter the market according to the indicator arrows, with green arrows indicating buy and red arrows indicating se
Quantum Heiken Ashi PRO MT4
Bogdan Ion Puscasu
4.33 (6)
Introducing the   Quantum Heiken Ashi PRO charts with alerts Designed to provide clear insights into market trends, the Heiken Ashi candles are renowned for their ability to filter out noise and eliminate false signals. Say goodbye to confusing price fluctuations and hello to a smoother, more reliable chart. What makes the Quantum Heiken Ashi PRO truly unique is its innovative formula, which transforms traditional candlestick data into easy-to-read colored bars. Red and green bars elegantly high
Linear Trend Predictor - A trend indicator that combines entry points and direction support lines. It works on the principle of breaking through the High/Low price channel. The indicator algorithm filters market noise, takes into account volatility and market dynamics. Indicator capabilities Using smoothing methods, it shows the market trend and entry points for opening BUY or SELL orders. Suitable for determining short-term and long-term market movements by analyzing charts on any timeframes.
This is the complete REX package. It consists of the lite, pro and ULTRA version.  Perfect for beginners and intermediates. REX complete is 100% non repaint. The strategy is based on a mix of different strategies, statistics, including pivot points, oscillators and patterns.  As the trading idea consists of a variety of some classic indicators like Momentum, Williams Percent Range, CCI, Force Index, WPR, DeMarker, CCI, RSI and Stochastic, it is clear that the fundamental indicators have being u
Description:  For a comprehensive understanding of our indicators, we invite you to explore the entire Q&A section within this MQL5 blog post   here . The "Divergence Strategy Indicator" is an advanced technical analysis tool designed to identify potential trend reversals and trend continuation opportunities in the market. It leverages the concept of divergence, a powerful phenomenon that occurs when price action diverges from an oscillator, indicating underlying shifts in market sentiment. Spot
Introduction It is common practice for professional trades to hide their stop loss / take profit from their brokers. Either from keeping their strategy to the themselves or from the fear that their broker works against them. Using this indicator, the stop loss / take profit points will be drawn on the product chart using the bid price. So, you can see exactly when the price is hit and close it manually.  Usage Once attached to the chart, the indicator scans the open orders to attach lines for t
RSI heatmap
Mr Pimook Chokdamrongsuk
Welcome to the world of trading and technical analysis. In today's fast-paced markets, understanding market sentiment and identifying potential entry and exit points is crucial for successful trading. One essential tool in a trader's arsenal is the Relative Strength Index, or RSI. And now, we introduce the Free RSI Heat Map, a powerful visualization tool that brings RSI data to life. RSI Heat Map offers a comprehensive overview of the RSI values across multiple instruments, allowing traders
FREE
The Range Directional Force Indicator is designed to help traders analyze market trends, reversals, and directional strength. It focuses on price movements within defined ranges, identifying key moments when the market is gaining momentum or preparing for a shift. By dividing the chart into dynamic price ranges, the indicator detects critical support and resistance levels. It calculates the directional force of price movements, highlighting potential entry and exit points based on market sentim
Harvest GOLD
Sayan Vandenhout
Harvest GOLD USES THE TREND WAVE INDICATOR AND IT CAN IDENTIFY THE BEGINNING AND THE END OF A NEW WAVE TREND MOVEMENT. AS AN OSCILLATOR, THE INDICATOR IDENTIFIES THE OVERBOUGHT AND OVERSOLD ZONES. IT WORKS GREAT TO CATCH THE SHORT TERM PRICE REVERSALS AND USES A MARTINGALE STRATEGY TO CLOSE ALL TRADES IN PROFIT. USE DEFAULT SETTINGS ON H1 OR HIGHER TIME FRAME ON ANY PAIR FOR MORE ACCURATE TRADES WHY THIS EA : Smart entries calculated by 3 great strategies The EA can be run on even a $30000
LineBreakMT4
Nattadecha Tangpakinwat
Key Features: Type of Indicator: Line Break Chart Indicator Usage: Identifying trend reversals and potential market turning points. Input Parameters: The primary input parameter is 'Lines_Break,' which represents the number of lines the price needs to move to create a new line in the opposite direction. How it works: The indicator draws green and red histogram bars to represent the line break chart. Green bars indicate an upward trend, and red bars indicate a downward trend. The indicator calcul
FREE
The main idea of this indicator is rates analysis and prediction by Fourier transform. Indicator decomposes exchange rates into main harmonics and calculates their product in future. You may use the indicator as a standalone product, but for better prediction accuracy there is another related indicator - FreqoMaster - which uses FreqoMeterForecast as a backend engine and combines several instances of FreqoMeterForecast for different frequency bands. Parameters: iPeriod - number of bars in the ma
Crypto_Forex Indicator "WPR and 2 Moving Averages"   for MT4 , No Repaint. WPR itself is one of the best oscillators for scalping. "WPR  and 2 Moving Averages"   Indicator allows you to   see Fast and Slow Moving Averages of WPR  oscillator. Indicator gives opportunities to see the price corrections  very early. It is very easy to set up this indicator via parameters,  it can be used on any time-frame. You can see   Buy and Sell entry conditions on the pictures. Consider Buy signal conditions:
Strong Oscillator is an indicator designed to find indicator trends. It finds trends using a set of algorithms and a set of indicators. This indicator is a trend indicator. Helps to find trends easily. You can use this indicator alone, or you can use it as an auxiliary indicator for other strategically appropriate indicators. You can use it as a trend validation indicator. Suggestions and Features There are 4 level lines on the indicator. These level lines 5, 20 and 80 are 95 lines. 5, 20 leve
EARLY REMINDER: The Starting price is 65 price will rise soon up to 365$ and then 750$ after first 10 copies of sales. Grab this offer now! Introduction Hello, traders! Welcome to the demonstration of the Forex Beast Indicator , a comprehensive tool designed to assist aspiring traders in navigating the complexities of the forex market. This indicator incorporates seven essential components to provide a well-rounded trading experience: Moving Averages Colored Zones Support and Resistance Levels
Free automatic Fibonacci is an indicator that automatically plots a Fibonacci retracement based on the number of bars you select on the BarsToScan setting in the indicator. The Fibonacci is automatically updated in real time as new highest and lowest values appears amongst the selected bars. You can select which level values to be displayed in the indicator settings. You can also select the color of the levels thus enabling the trader to be able to attach the indicator several times with differe
FREE
Buyers of this product also purchase
Trade Assistant MT4
Evgeniy Kravchenko
4.43 (183)
It helps to calculate the risk per trade, the easy installation of a new order, order management with partial closing functions, trailing stop of 7 types and other useful functions. Additional materials and instructions Installation instructions   -   Application instructions   -   Trial version of the application for a demo account Line function -   shows on the chart the Opening line, Stop Loss, Take Profit. With this function it is easy to set a new order and see its additional characteris
Forex Trade Manager MT4
InvestSoft
4.98 (398)
Welcome to Trade Manager MT4 - the ultimate   risk management tool   designed to make trading more intuitive, precise, and efficient. This is not just an order placement tool; it's a comprehensive solution for seamless trade planning, position management, and enhanced control over risk. Whether you're a beginner taking your first steps, an advanced trader, or a scalper needing rapid executions, Trade Manager MT4 adapts to your needs, offering flexibility across all markets, from forex and indice
Local Trade Copier EA MT4
Juvenille Emperor Limited
5 (90)
Experience exceptionally  fast trade copying with the Local Trade Copier EA MT4 . With its easy 1-minute setup, this trade copier allows you to copy trades between multiple MetaTrader terminals on the same Windows computer or Windows VPS with lightning-fast copying speeds of under 0.5 seconds. Whether you're a beginner or a professional trader, the Local Trade Copier EA MT4 offers a wide range of options to customize it to your specific needs. It's the ultimate solution for anyone looking to inc
Grid Manual MT4
Alfiya Fazylova
4.71 (17)
Grid Manual is a trading panel for working with grid strategies. The utility is universal, has flexible settings and an intuitive interface. It works with a grid of orders not only in the direction of averaging losses, but also in the direction of increasing profits. The trader does not need to create and maintain a grid of orders, the utility will do it. It is enough to open an order and the Grid manual will automatically create a grid of orders for it and will accompany it until the close. Ful
Trade Manager MT4 DaneTrades
Levi Dane Benjamin
4.4 (10)
Trade Manager to help you quickly enter and exit trades while automatically calculating your risk. Including features to help prevent you from Over Trading, Revenge Trading and Emotional Trading. Trades can be managed automatically and the account performance metrics can be visualised in a graph. These features make this panel ideal for all manual traders and it helps to enhance the MetaTrader 4 platform. Multi Language support. MT5 Version  |   User Guide + Demo The Trade Manager does not work
Exp COPYLOT CLIENT for MT4
Vladislav Andruschenko
4.69 (65)
Trade copier for MetaTrader 4.   It copies forex trades, positions, and orders from any accounts. It is one of the best trade copiers   MT4-MT4, MT5 - MT4   for the   COPYLOT MT4   version (or   MT4 - MT5 MT5 - MT5   for the   COPYLOT MT5   version).        MT5 version Full Description +DEMO +PDF   How To Buy    How To Install     How to get Log Files    How To Test and Optimize    All products from Expforex Copier  version for      MetaTrader 5  terminal ( МТ5 - МТ5, МТ4 - МТ5 )-  Copylot Cli
The MT4 to Telegram Signal Provider is an easy-to-use, fully customizable utility that enables the sending of signals to Telegram, transforming your account into a signal provider. The format of the messages is fully customizable! However, for simple usage, you can also opt for a predefined template and enable or disable specific parts of the message. [ Demo ] [ Manual ] [ MT5 Version ] [ Discord Version ] Setup A step by step user guide is available. No knowledge of Telegram API is required; a
HFT Fast Scalping EA
Sami George Saba Zeidan
HFT FAST SCALPING EA the High Frequency Trading which use stop orders to enter the trades when market is trending, It is basically designed for US30 just at opening of US30 in New York Session. Limited price $350 is only for 10 first sales. After 10 sales, the price will be raised +$100. Final price for  HFT FAST SCALPING EA    $1200 STARTING FROM 1 JANUARY 2025. best use for 1- Low slippage brokers for us30 and DE40 . 2- LOW OR ZERO COMMISSION BROKERS FOR EUR AND GOLD. 3-Prop firms like ftmo
Forex copier
Alexandr Bryzgalov
We offer simple and reliable software that can  copy trades  between any MT4 accounts. Easy to use MetaTrader copier which saves valuable time Reliable, so you are protected from technical issues Powerful, with a lot of features available Who can use this MT4 copier? Forex Copier is a solution for individual traders or account managers who need to execute trade signals from external sources or who need to  manage several MetaTrader 4 accounts  at the same time. We do not offer you “yet another
Trade Dashboard MT4
Fatemeh Ameri
5 (46)
Tired of complex order placement and manual calculations? Trade Dashboard is your solution. With its user-friendly interface, placing orders becomes effortless, by a single click, you can open trades, set stop loss and take profit levels, manage trade lot size, and calculate risk to reward ratios, allowing you to only focus on your strategy. Say goodbye to manual calculations and streamline your trading experience with Trade Dashboard. Download  Demo Version  right now. You can find  Details of
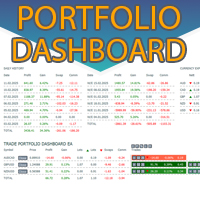
Instantly see your closed trade history by day and week, your current open trades, and forex exposure on one chart! Use the heatmap to identify profitable trades and where your current drawdown is within your trading portfolio. Quick Close Buttons Use the quick close buttons to close every trade on a single symbol, close out individual trades in full, or take partial profits or losses at the click of a button. No more hunting for trades in a list and working out how to close part of your trades.
Custom Alerts MT4
Daniel Stein
5 (6)
Custom Alerts: Monitor Multiple Markets and Never Miss a Key Setup Overview Custom Alerts is a dynamic solution for traders who want a consolidated way to track potential setups across multiple instruments. By integrating data from our flagship tools—such as FX Power, FX Volume, and IX Power— Custom Alerts automatically notifies you of crucial market developments without juggling multiple charts or missing prime opportunities. If you’re ready to trade smarter and more efficiently, Custom Alert
******************************* ***************** ********************** ***************** ********************** ************************* GoldMine Train is a Trend trading strategy EA for Gold. Operator determines the major trend direction and instruct the Train to go. The Train will continuously BUY/SELL in the direction. Lot volume will depends on the Account Balance and preset Leverage ratio. When Operator change the trend direction, the Train will stop and lock the profit. User can easil
TradePanel MT4
Alfiya Fazylova
4.9 (86)
Trade Panel is a multifunctional trading assistant. The application contains more than 50 trading functions for manual trading and allows you to automate most trading operations. Attention, the application does not work in the strategy tester. Before purchasing, you can test the demo version on a demo account. The demo version is here . Full instructions here . Trade. Allows you to perform trading operations in one click: Open pending orders and positions with automatic risk calculation. Open mu
The product will copy all telegram signal to MT4   ( which you are member  ) , also it can work as remote copier.  Easy to set up, copy order instant, can work with almost signal formats, image signal, s upport to translate other language to English Work with all type of channel or group, even channel have "Restrict Saving Content", work with  multi channel, multi MT5 Work as remote copier: with signal have ticket number, it will copy exactly via ticket number. Support to backtest signal. How to
Trade copier MT4
Alfiya Fazylova
4.52 (29)
Trade Copier is a professional utility designed to copy and synchronize trades between trading accounts. Copying occurs from the account / terminal of the supplier to the account / terminal of the recipient, which are installed on the same computer or VPS . Before buying, you can test the demo version on a demo account. Demo version here . Full instruction here . Main functionality and benefits: Supports copying MT4> MT4, MT4> MT5, MT5> MT4, including MT5 netting accounts. * Supports copying Dem
Trade Assistant Pro 36 in 1
Makarii Gubaydullin
4.95 (19)
Multifunctional tool: Lot Calculator, Grid Orders, R/R ratio, Trade Manager, Supply and Demand zones, Price Action and much more Demo version   |   User manual Trade Assistant   doesn't work in the strategy tester: you can download the Demo Version HERE  to test the utility . Contact me for any questions  / ideas for improvement / in case of a bug found If you need a MT5 version, it is available   here Simplify, speed up and automate your trading process . Expand the standard terminal capabili
Copier->Convenient and fast interface interaction, users can use it right away   ->>>> Recommended to use on Windows computers or VPS Windows Features: Diversified and personalized copy trading settings: 1. Different lot modes can be set for different signal sources 2. Different signal sources can be set for forward and reverse copy trading 3. Signals can be set with comments 4. Whether to calibrate the lot according to the contract lot Diversified and personalized copy order settings 2: 1. Dif
Trend Line Optimizer
Evgenii Aksenov
4.06 (18)
This is an automatic parameter optimizer for the   Trend Line PRO   indicator Easily and quickly you will select the optimal parameters for your favorite Trend Line PRO indicator.  Optimization takes only a few seconds. The optimizer allows you to find the best parameters for each pair and period: Amplitude, TP1-TP3, StopLoss, as well as values for Time Filter and HTF Filter on the selected history section (Days)  To optimize different timeframes, you need a different range of history: M5-M15
Edge Zone EA
FXsolutions
5 (1)
With this Expert Advisor you will follow the sound trading principle Buy Low and Sell High by default ! And you can do that even with a normal day job . You will be even able to trade on lower timeframes which you could never do without such an Expert Advisor. And the best thing is that you are in control! You can tell the Edge Zone EA where it has to enter and where it has to exit. And you can do that even many hours before the trade will occur . This EA is therefore an excellent assistant for
OrderManager MT4
Lukas Roth
4.68 (22)
Introducing the OrderManager : A Revolutionary Utility for MT4 Manage your trades like a pro with the all-new Order Manager utility for MetaTrader 4. Designed with simplicity and ease-of-use in mind, the Order Manager allows you to effortlessly define and visualize the risk associated with each trade, enabling you to make informed decisions and optimize your trading strategy. For more information about the OrderManager, please refear to the manual. [ Demo ]  [ Manual ]  [ MT5 Version ]  [ Telegr
KT Equity Protector MT4
KEENBASE SOFTWARE SOLUTIONS
3.4 (5)
KT Equity Protector EA consistently monitors the account equity and closes all the market and pending orders once the account equity reached a fixed equity stop loss or profit target.  After closing all trading positions, the EA can close all open charts to stop other expert advisors from opening more trading positions. Equity Stop-Loss If your current account balance is $5000 and you set an equity stop loss at $500. In this case, the KT Equity Protector will close all the active and pending or
Comprehensive on chart trade panel with the unique ability to be controllable from mobile as well. Plus has a library of downloadable configuration, e.g. exit rules, extra panel buttons, pending order setup and more. Please see our product video. Works with all symbols not just currency pairs. Features On chart panel plus controllable from free app for Windows, iPhone and Android Built-in script engine with library of downloadable configuration, e.g. add 'Close All Trades in Profit' button, exit
Exploit currency inefficiencies for risk-free trading A triangular arbitrage strategy exploits inefficiencies between three related currency pairs, placing offsetting transactions which cancel each other for a net profit when the inefficiency is resolved. A deal involves three trades, exchanging the initial currency for a second, the second currency for a third, and the third currency for the initial. With the third trade, the arbitrageur locks in a zero-risk profit from the discrepancy that exi
Zone Trader MT4
LEE SAMSON
5 (2)
Trade support and resistance or supply and demand zones automatically once you have identified the key areas you want to trade from. This EA allows you to draw buy and sell zones with a single click and then place them exactly where you expect price to turn. The EA then monitors those zones and will automatically take trades based on price action you specify for the zones. Once the initial trade is taken, the EA will then get out in profit at the opposite zone you place, which becomes the target
Auto Trade Copier
Vu Trung Kien
4.7 (90)
Auto Trade Copier is designed to copy trades to multiple MT4, MT5 and cTrader accounts/terminals with 100% accuracy. The provider and receiver accounts must be on the same PC/VPS. With this tool, you can copy trades to receiver accounts on the same PC/VPS. All trading actions will be copied from provider to receiver perfectly. This version can be used on MT4 accounts only. For MT5 accounts, you must use Auto Trade Copier for MT5 . Reference: - For MT4 receiver, please download Trade Receiver Fre
FSS Report
Bao Ying Huang
5 (2)
This is a professional report statistical indicator, which can be counted by day, week, month, quarter, year, magic and comment, and display the growth curve. install: select "File" in your MT4 client,and open the folder "MQL4\indicators",then copy file "FSS_Report.ex4",reload MT4 and enjoy. Para List: UI_XY_Setting=21 UI_X_default=0 UI_Y_default=21 custom_title=FSS Report UI_reload_time_interval=5 report_time_from=0 report_time_to=0 filter_demo=____________symool, magic and comment, all supp
CAP Strategy Builder EA
MEETALGO LLC
4.84 (31)
The top-selling EAs on the market cost a lot and one day they are suddenly gone. This is because one strategy will not work in the forex market all the time. Our product is unique from all others in the MQL Marketplace because our EA comes with 34+ built-in indicators that allow develop strategies every time.  You build your strategy and keep updating it. If one strategy does not work, simply build another all using only one EA. This is All-In-One EA in this market place. You can use as trade ma
Summer 40% discount ($149 -> $88) Everything for chart Technical Analysis indicator mt4 in one tool Draw your supply demand zone with rectangle and support resistance with trendline and get alerts to mobile phone or email alert -  Risk reward indicator Video tutorials, manuals, DEMO download   here .  Find contacts on my   profile . 1.   Extended rectangles and trendlines Object will be extended to the right edge of the chart when price will draw new candles on chart. This is rectangle extende
DrawDown Limiter MT4
Haidar, Lionel Haj Ali
5 (8)
Drawdown Limiter EA You are in the right place if you were searching for Drawdown control, Drawdown limiter, Balance protection, Equity Protection or Daily Drawdown Limit related to Prop Firm, FTMO, or Funded account trading, or if you want to protect your trading account. Have you suffered from controlling your drawdown when trading funded accounts? This EA is meant for you. Prop firms usually set a rule called “Trader Daily Drawdown”, and if it is not respected, you are disqualified.  I am an
More from author
Multi Chart Crosshairs MT5
Robert Gerald Wood
5 (4)
This indicator is designed to make reviews of many charts on different timescales quicker, and easier to do. Track Time and Price across multiple charts Change Symbol on one chart and all other charts of the same symbol will be changed too. Easy to use, quick to master The indicator allows you to identify the price and time where the mouse pointer is on the current chart, across all other charts open on the same Symbol. This allows you to quickly see information on multiple charts whereas norma
TheStrat Monitor
Robert Gerald Wood
3 (2)
If you've not already learnt about The Strat trading strategy , go google it now. I promise it won't be a waste of your time, and you will likely learn some new tricks whether you use it or not. OK, so now you know what TheStrat is, you will be able to understand what this indicator can do for you. Key Features In short, the Indicator will: Show Timeframe Continuity for all supported timeframes Supports two timeset views, Day trader and Swing trader Show when Full Timeframe Continuity is in pla
TheStrat Levels
Robert Gerald Wood
This indicator draws the prior Highs and Lows for multiple timeframes, and can display potential Take Profit and Stop Loss levels. In Rob Smith's # The Strat   terms,   these are potential entry points, or alternatively potential targets for open positions. I like to use them in both ways. On a lower timeframe, say 5 minutes to get a good entry on a daily or weekly level, and then as a potential target. Very small stops required giving an excellent risk/reward ratio. Please watch the DEMO video
TheStrat Patterns
Robert Gerald Wood
This indicator will draw patterns based on Rob Smith's The Strat as they emerge in real time on your chart. As price evolves, TheStrat offers 18 distinct price action patterns that can help you get good entries in the market. Each pattern involves two or three candles, and this indicator will draw a bounding box around the candles and name the pattern. The indicator also shows when a potential setup is forming, known by stratters as an Actionable signal. Candles Each candle is defined by its
TheStrat FTFC
Robert Gerald Wood
FTFC refers to Full Timeframe Continuity as defined by Rob Smith's The Strat . This indicator draws two lines on the chart, one of the highest of the Quarterly, Monthly, Weekly, Daily or Hourly opening levels, and the second of the lowest of those values. This gives you a channel above or below which trading is more likely to be very strongly in one direction. Between the lines, price action will be choppier and you may with to use wider stops. A third dashed line is also drawn to show the mid p
Active Pivot Levels
Robert Gerald Wood
5 (1)
Pivot levels are a well established technical level that's recognised in every market. This indicator will draw the current Quarterly, Monthly, Weekly, Daily and four-hourly pivots on the chart, for any symbol. You can also show the Suppport and Resistance levels for each period and choose which to display from levels 1 to 4.   Choose the type of Pivot from: Standard Camarilla DeMark Woodie Fibonacci Please note, DeMark pivots have a single Support and Resistance level as per the original speci
TheStrat Candles
Robert Gerald Wood
5 (1)
This indicator will draw a label above or below each candle based on   Rob Smith's   The Strat   as they develop over time on your chart. As price evolves, a candle can switch between three states. When the candle first opens, if it sits completely within the previous candles high and low, then it will start as a Type 1. As time moves on, if it breaks either the high or low of the previous candle, it will be come a type 2, and should the price action be volatile and directionless, it may then
When trading using The Strat , it is important to keep an eye on multiple timeframes. This indicator will show the Daily, Weekly, Monthly and Quarterly state of the current candle for each timeframe. A Circle icon shows that the candle on that timeframe is currently an Inside, or Type 1 in TheStrat terminology. An Inside Day candle is consolidating price action, and we are looking for a breakout of the range. A Triangle icon, pointing up or down, is a trending candle, or Type 2 in TheStrat termi
Multi Chart Crosshairs
Robert Gerald Wood
5 (1)
This indicator is designed to make reviews of many charts on different timescales quicker, and easier to do. Track Time and Price across multiple charts Change Symbol on one chart and all other charts of the same symbol will be changed too. Easy to use, quick to master The indicator allows you to identify the price and time where the mouse pointer is on the current chart, across all other charts open on the same Symbol. This allows you to quickly see information on multiple charts whereas normal
A simple script that can delete all the drawing objects on a chart, or just the objects of a specific type. Settings: DeleteObjectsOfType By default the value will be blank which means ALL drawing objects on the chart will be deleted. If you only wish to delete specific types of drawing object, change this setting to the type of object to delete. For example, Fibonacci Retracement, Text, Label or Trend Line. Please see the demonstration video for more information.
FREE
I created this simple indicator while I was learning about Rob Smith's TheStrat and find it so helpful, I thought I would share it with you. If you find it useful, please look at the other indicators I have published on MQL5. The indicator simply draws a single line on the chart showing the price level you select from a higher timeframe. Using the settings you have full control over the timeframe it displays but b y default, it calculates the higher timeframe itself, just moving up the scale by
FREE
This script allows you to toggle the "Show Trade Levels" option, but for the current chart only. Normally, you can only change the setting using the Options -> Chart menu for ALL charts, but this script allows you to do it for a SINGLE chart. I'm using it when I take screenshots, because most of the time I'm not trying to show the trades, just some functionality of one of my other tools. Iif you need that functionality, then this script is very helpful! If the script helps you, please let me k
FREE
Round Price Levels
Robert Gerald Wood
Markets really love round numbers and they often act as support in a falling market, or resistance as price rises. This indicator is designed to draw price levels at Round values. It does this automatically, but you also have the option to override that and determine the levels you wish to see. A round level can be as simple as steps of 10, so 10, 20, 30 etc or if you are working with Forex, maybe you want to see changes at 0.1 or 0.01. The indicator draws two classes of line, Major and Minor, e
ATR Extremes
Robert Gerald Wood
Average True Range (ATR) is a commonly used indicator that measures the amount of movement in price over a set duration. However the value it gives is not defined within any sort of boundary, which makes using it for anything other than stop loss or take profit calculations, almost impossible. This indicator is your standard ATR indicator, but we have introduced percentile demarcations so you can see the extremes. You can choose between Percentiles and something we call Split Medians Percentile
Range Exhaustion
Robert Gerald Wood
Range Exhaustion occurs when price meets or exceeds the expected range for the current period. At these levels, price starts to lose its momentum relative to earlier in the period, so its a good point to make sure you are not taking new positions. This indicator will show you where this is likely to happen on your chart, showing levels for Daily, Weekly and Monthly periods. When you see price exceeding these exhaustion levels, it's telling you that the momentum behind the move is very strong an
This indicator will draw a label above or below each candle based on   Rob Smith's   The Strat   as they develop over time on your chart. As price evolves, a candle can switch between three states. When the candle first opens, if it sits completely within the previous candles high and low, then it will start as a Type 1. As time moves on, if it breaks either the high or low of the previous candle, it will be come a type 2, and should the price action be volatile and directionless, it may then
TheStrat Levels MT5
Robert Gerald Wood
5 (1)
This indicator draws the prior Highs and Lows for multiple timeframes, and can display potential Take Profit and Stop Loss levels. In Rob Smith's # The Strat  terms, these are potential entry points, or alternatively potential targets for open positions. I like to use them in both ways. On a lower timeframe, say 5 minutes to get a good entry on a daily or weekly level, and then as a potential target. Very small stops required giving an excellent risk/reward ratio. Key Features  - Levels from Hou
TheStrat FTFC MT5
Robert Gerald Wood
FTFC refers to Full Timeframe Continuity as defined by Rob Smith's  The Strat  . This indicator draws two lines on the chart, one of the highest of the Quarterly, Monthly, Weekly, Daily or Hourly opening levels, and the second of the lowest of those values. This gives you a channel above or below which trading is more likely to be very strongly in one direction. Between the lines, price action will be choppier and you may with to use wider stops. A third dashed line is also drawn to show the mid
This indicator will draw patterns based on   Rob Smith's   The Strat   as they emerge in real time on your chart. As price evolves,   TheStrat   offers 18 distinct price action patterns that can help you get good entries in the market. Each pattern involves two or three candles, and this indicator will draw a bounding box around the candles and name the pattern. The indicator also shows when a potential setup is forming, known by stratters as an Actionable signal. Candles Each candle is defin
TheStrat Monitor MT5
Robert Gerald Wood
5 (1)
If you've not already learnt about The Strat trading strategy , go google it now. I promise it won't be a waste of your time, and you will likely learn some new tricks whether you use it or not. OK, so now you know what TheStrat is, you will be able to understand what this indicator can do for you. Key Features In short, the Indicator will: Show Timeframe Continuity for all supported timeframes Supports two timeset views, Day trader and Swing trader Show when Full Timeframe Continuity is in pla
TheStrat TFC Monitor MT5
Robert Gerald Wood
5 (1)
When trading using  The Strat , it is important to keep an eye on multiple timeframes. This indicator will show the Daily, Weekly, Monthly and Quarterly state of the current candle for each timeframe. A Circle icon shows that the candle on that timeframe is currently an Inside, or Type 1 in TheStrat terminology. An Inside Day candle is consolidating price action, and we are looking for a breakout of the range. A Triangle icon, pointing up or down, is a trending candle, or Type 2 in TheStrat term
Pivot levels are a well established technical level that's recognised in every market. This indicator will draw the current Quarterly, Monthly, Weekly, Daily and four-hourly pivots on the chart, for any symbol. You can also show the Suppport and Resistance levels for each period and choose which to display from levels 1 to 4.   Choose the type of Pivot from: Standard Camarilla DeMark Woodie Fibonacci Please note, DeMark pivots have a single Support and Resistance level as per the original specif
Markets really love round numbers and they often act as support in a falling market, or resistance as price rises. This indicator is designed to draw price levels at Round values. It does this automatically, but you also have the option to override that and determine the levels you wish to see. A round level can be as simple as steps of 10, so 10, 20, 30 etc or if you are working with Forex, maybe you want to see changes at 0.1 or 0.01. The indicator draws two classes of line, Major and Minor,
ATR Extremes MT5
Robert Gerald Wood
Average True Range (ATR) is a commonly used indicator that measures the amount of movement in price over a set duration. However the value it gives is not defined within any sort of boundary, which makes using it for anything other than stop loss or take profit calculations, almost impossible. This indicator is your standard ATR indicator, but we have introduced percentile demarcations so you can see the extremes. You can choose between Percentiles and something we call Split Medians Percentile
Range Exhaustion occurs when price meets or exceeds the expected range for the current period. At these levels, price starts to lose its momentum relative to earlier in the period, so its a good point to make sure you are not taking new positions. This indicator will show you where this is likely to happen on your chart, showing levels for Daily, Weekly and Monthly periods. When you see price exceeding these exhaustion levels, it's telling you that the momentum behind the move is very strong an
Filter:
crivelazquez
15
crivelazquez 2024.08.20 04:41 
 

excelente tank very muchexcelente tank very much

Kedrov
597
Kedrov 2024.08.03 10:52 
 

Hi! It works great! Thank you! Good luck!

Christian Astillero
1208
Christian Astillero 2022.03.08 14:52 
 

User didn't leave any comment to the rating

Robert Gerald Wood
4747
Reply from developer Robert Gerald Wood 2022.04.01 12:01
Thank You!
CasiousD
819
CasiousD 2021.10.30 19:39 
 

User didn't leave any comment to the rating

Payman
700
Payman 2021.04.16 15:05 
 

User didn't leave any comment to the rating

Robert Gerald Wood
4747
Reply from developer Robert Gerald Wood 2021.04.16 15:08
Hello again Payman, you're now my biggest fan :)
Being able to exclude object of a type is a good idea, definitely adding that to the to-do list for the next version. Thank you!
tr4ppist
97
tr4ppist 2021.04.15 17:41 
 

User didn't leave any comment to the rating

Robert Gerald Wood
4747
Reply from developer Robert Gerald Wood 2021.04.15 17:43
Thats really kind of you. Thanks for taking the time to leave a review, I appreciate it :).
Reply to review
Version 1.2 2022.11.13
Added option to copy Indicator window objects as well as those in the main chart window. Rely's on the second chart already having the Indicators attached, and in the same order as the source chart.

New Option: CopyIndicatorWindowObjects (true/false)

By default the option is set to false, so it will not affect existing users unless they take action and set the option to true.
Version 1.1 2021.04.15
Fixed bug where the text for the first fibo level was not cloned correctly.