Flat Horizontal Channel Range Price MT5
- Indicators
- Mariia Logvinenko
- Version: 1.1
- Updated: 5 April 2021
- Activations: 5
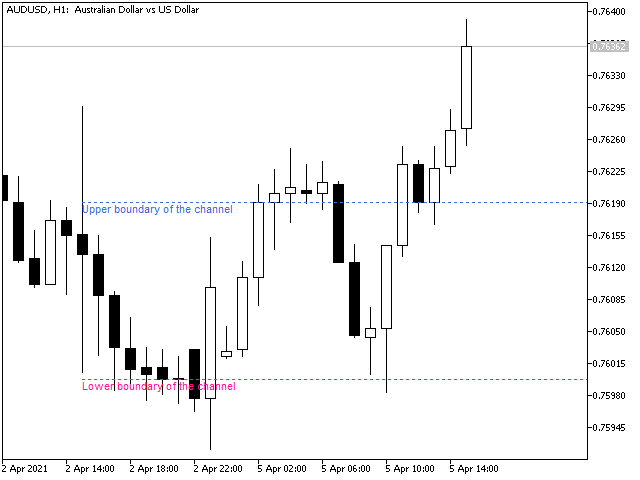
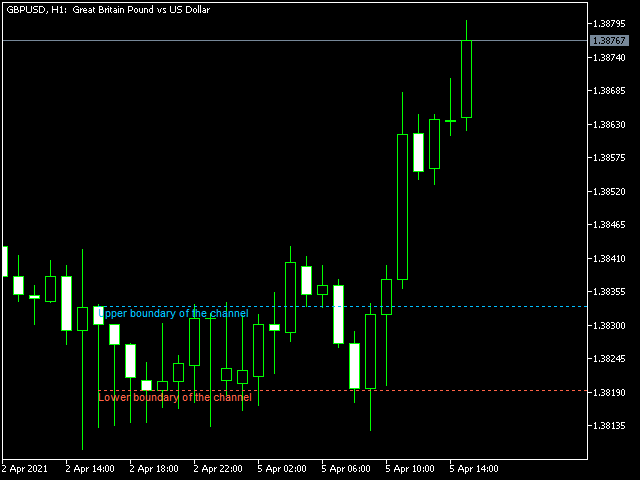
The Flat Horizontal Channel Range Price indicator automatically draws a horizontal channel (range) of prices on a higher or current timeframe. This indicator was developed to simplify the determination of sideways movements of the market, as well as to search for entry signals for a pullback from the boundaries of a channel (range) or for its breakdown.
Input parameters:
BarsCount - 1000 - Number of bars to search for a horizontal channel
AutoPeriodDraw - true - Enabled automatic drawing of a horizontal channel on a higher timeframe
PeriodCur - 60 - Timeframe for drawing a horizontal channel if AutoPeriodDraw = false
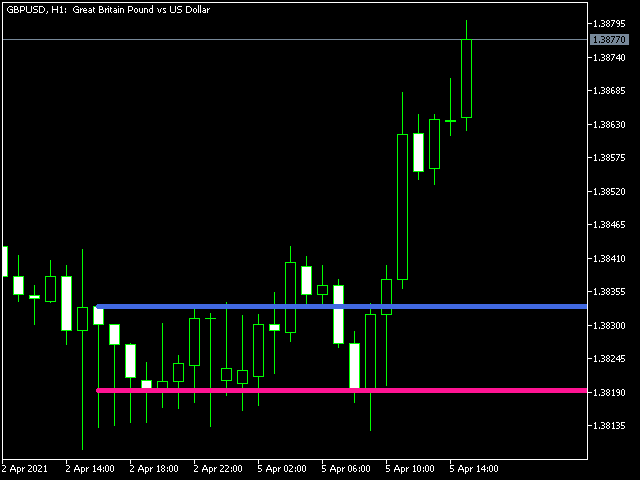
color_lin_up - color of the upper border of the channel
color_lin_down - color of the lower border of the channel
linestule - line style
linewidth - line width
background - true - display in the background
VisibleText - true - Display of border name is enabled
chanel_update_delay_tick - 100 - delay in redrawing the horizontal channel on a new bar