• Overview
  • Reviews
  • Comments
  • What's new

Ichimoku Map

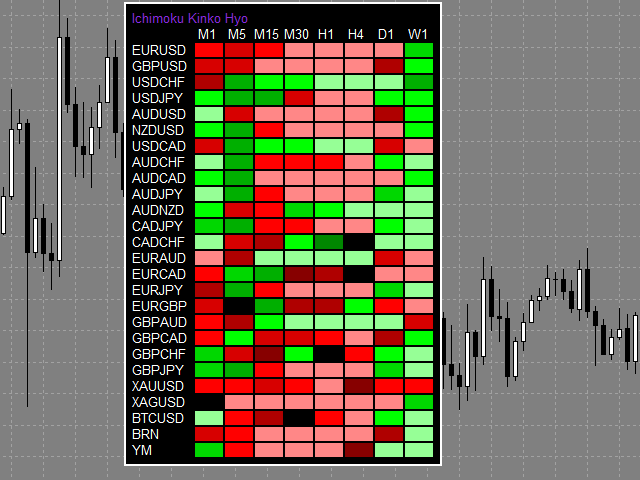
Ichimoku Map (instant look at the markets) - built on the basis of the legendary Ichimoku Kinko Hyo indicator.
The task of the Ichimoku Map is to provide information about the market strength on the selected time periods and instruments, from the point of view of the Ichimoku indicator.

The indicator displays 7 degrees of buy signal strength and 7 degrees of sell signal strength.
The stronger the trend, the brighter the signal rectangle in the table.

The table can be dragged with the mouse.
The size of the table depends on the font size selected in the settings.
When you hover the mouse cursor over a rectangle, the tooltip displays the signal strength and the description of the situation, as well as the tool and the time period that this rectangle corresponds to.
When you click on the selected rectangle of the table, the tool and/or time period changes or a new chart window opens.
If Current_Chart is selected in the New_Chart_or_Current_Chart setting, then the time period and the tool will be changed to those that correspond to the selected rectangle.
If New_Chart is selected in the New_Chart_or_Current_Chart setting, a new window with a graph will be opened, the time period and tool of which correspond to the selected rectangle.
In the Template_name_for_New_Chart setting, you can specify a chart template with which a new window will be opened.


Signal strength and interpretation of terms

  • Each signal changes the degree of signal strength:
  • cK - Kumo color (clouds) +1 point.
  • TK - Golden and Dead Cross +1 point.
  • C  - Chinkou confirmation +1 point.
  • K  - Kumo Breakout (Clouds) +2 points.
  • pK - Kijun Breakout +1 point.
  • pT - Tenkan Breakout +1 point.
  • !K - The price is in the cloud(Kumo) -1 point.


Settings 

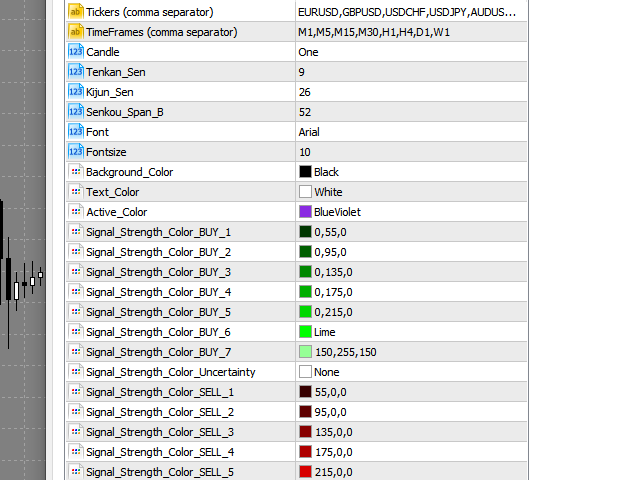
  • Tickers - Tools to be displayed in the table (separated by commas).
  • TimeFrames - Time periods to be displayed in the table (separated by commas).
  • Table_Refresh_Rate (in seconds) - the refresh rate of the table is measured in seconds.
  • Candle - if Candle=One, the indicator works with the last closed candle and does not redraw.
    If Candle=Zero, the indicator works with the last open candle.
  • In other indicator settings, you can change the color of the signal rectangles, font, font size, table background color, table font color, as well as the classic parameters of the Ichimoku indicator.
  • New_Chart_or_Current_Chart - the mode of opening a new chart: in a new window or changing the instrument and time period in the window in which the indicator is running.
  • Template_name_for_New_Chart - the name of the template with which the new chart will be opened.


Ichimoku is an indicator developed in the 1930s by the Japanese analyst Goichi Hosoda, who published under the pseudonym Sanjin Ichimoku, to predict the movement of the Japanese Nikkei stock index.
The Ichimoku indicator combines several approaches to market analysis and is designed to identify trends, support and resistance lines, and generate buy/sell signals.
Hosoda Goichi spent more than thirty years perfecting his indicator and published the results only in 1968.
Ichimoku - can be roughly translated as "instant look at the balance".

Recommended products
Echo One Full
Phongkrit Phattanawijak
Echo One: The provided robot is a result of several Test of trading many many strategies,various indicators of forecasting, To make the best decision for making profits in markets. By combining several strategies and algorithms in this robot, at changing each tick price, with the utmost precision and speed  Real account has been opened where it will be possible to analyze the entire history, as well as constantly, in real time, monitor all current results: https://www.mql5.com/en/signals/71
Floating peaks oscillator - it the manual trading system. It's based on Stochastik/RSI type of oscillator with dynamic/floating  overbought and oversold levels. When main line is green - market is under bullish pressure, when main line is red - market is under bearish pressure. Buy arrow appears at the floating bottom and sell arrow appears at floating top. Indicator allows to reverse signal types. Main indicator's adjustable inputs : mainTrendPeriod; signalTrendPeriod; smoothedTrendPeriod; tre
Primus Trading Engine is a trading system that combines price action,ratio based indicators & custom indicators to create this leading indicator with a multi-timeframe approach to give you high probability trade setups for forex,CFD cash/futures,metals & binary option to assist in making predictions on what is MOST likely to happen in the market Main Chart Features Price Action Signal-Arrow displayed on a specific bar;NOT buy/sell arrow;DOES NOT repaint;Bullish arrow on a bullish bar,price is l
Trend Filter Pro
Aleksandr Makarov
Trend Filter Pro Trend filter indicator. Very good filter for your trading system, I recommend to use it together with - System Trend Pro   and  Professional Trade Arrow The indicator no repaint!!! Settings: Change the Period parameter for better filtering ( default is 90) Any questions? Need help?, I am always happy to help, write me in private messages or In Telegram: https://t.me/Trader35_Admin
FREE
Trend broker killer
Mansour Rahkhofteh
Available with multi time frame choice to see quickly the TREND! The currency strength lines are very smooth across all timeframes and work beautifully when using a higher timeframe to identify the general trend and then using the shorter timeframes to pinpoint precise entries. You can choose any time frame as you wish. Every time frame is optimized by its own. Built on new underlying algorithms it makes it even easier to identify and confirm potential trades. This is because it graphically show
Icarus Bolli-Band Change Display(TM) Indicator is a simple, but highly effective tool for visually identifying areas where the all-important 'Bollinger Band' values are in a state of expansion, contraction of neither. The traditional Bollinger Bands have been widely applied to trading charts globally since their creation by John Bollinger several decades ago. One of the limitations of the traditional Bollinger Bands is the ability to clearly identify when the bands are in fact expanding or contr
This is a correlation hedge type indicator which helps trade the obscure relationship between crude oil and natural gas markets. Which is overall an unknown trading concept to most traders, yet a very impressive one. The usual market risk is mittigated through the smooth trend of hedge tading, as well as the leading signals the indicator provides! Pros: low risk trading, normal profits, no need to be right about either market Cons:  requires large capital ----------------------------------
Parabolic Pro
Yaroslav Varankin
Modified Parabolic SAR: Your Reliable Market Assistant This enhanced version of the Parabolic SAR indicator effectively reflects the trend direction and can serve as an excellent addition to your trading strategy. Advantages: Trend Direction Reflection: The indicator accurately depicts the market trend direction, aiding you in making informed trading decisions. Signal Filtering: It can serve as an effective filter, complementing your strategy by helping to eliminate false signals and execute mo
FREE
Trend Reversal Identifier es un indicador de análisis profundo que no repinta de alto rendimiento que sirve para detectar y confirmar Pullbacks, Soportes y Resistencias.  También posee un alto valor para detectar divergencias al tener los movimientos alcista y bajistas dados por separado con mucha claridad.  Debido a la estructura implícita del algoritmo es plenamente válido para cualquier par/periodo y no necesita configuración. Tenemos dos zonas principales: Zona Up y Zona Down, las cuales a s
The Mono Waves indicator is designed to display the wave behavior of the market on a chart. Its appearance is presented on slide 1.   This indicator uses the PPPC (Point-Percent Price Channel) indicator, which can be downloaded for free from the Market .             When the market moves up, the upper border of the price channel is built on High candlestick prices (for more details, see the description of the PPPC indicator at the link given above). The higher the High prices rise, t
FREE
MACD Alerts MT4
KEENBASE SOFTWARE SOLUTIONS
KT MACD Alerts is a personal implementation of the standard MACD indicator available in Metatrader. It provides alerts and also draws vertical lines for the below two events: When MACD crosses above the zero line. When MACD crosses below the zero line. Features It comes with an inbuilt MTF scanner, which shows the MACD direction on every time frame.  A perfect choice for traders who speculate the MACD crossovers above/below the zero line. Along with the alerts, it also draws the vertical line
Kaka Kaki EurUsd Pro Scalp: Introducing   Kaka Kaki EurUsd Pro Scalp , the cutting-edge solution in low-risk automated trading. Unlike conventional systems that tailor strategies to historical data, Kaka Kaki EurUsd Pro Scalp is meticulously crafted to operate on low-risk settings. This distinguishes it from the commonplace "take and throw" systems reliant on simple lot size with grids optional for survival. This EA offers a unique approach, prioritizing risk management and ensuring a sophistica
Quantum Pro Deluxe
Luis Mariano Vazquez Marcos
Experimente el poder del Asesor Experto "QUANTUM", un algoritmo meticulosamente diseñado para operar en el mercado del oro. Este asesor experto ha demostrado consistentemente excelentes resultados en rigurosas pruebas retrospectivas (backtesting), destacándose por su capacidad para capitalizar las tendencias del oro con precisión y eficacia. Parámetros Recomendados: TODAS LAS DIVISAS Periodo M5, M15 , M30 Y H1 AUTOAJUSTABLE EL LOTAJE POR FACTOR DE RIESGO Disclaimer de Riesgo:   El uso de este As
Sonic MT4
Jalaluddin Raheemi
only 3 copies will be sold at the current price and then the price will increase to $399. Sonic EA is the result of studying and testing our best trading strategies and combining them with Artificial Intelligence technology. This EA is a perfect combination of quality, technology, intelligence, safety, and experience. This is just the start of this project, Every week our team works hard to improve this trading algorithm and add the best features to it.   Monitoring : Sonic MT5 1 Signal new (
The Finance Craft bot is suitable for everyone who was looking for a universal scalpel but cannot dwell on a specific product, because in all of them it notices flaws or does not understand the trading strategy. For those who fall into this category of searchers, there is good news - this bot is for you! In the description presented below, only essential information will be provided, and nothing superfluous. The first important point is that the bot works on both Netting and Hedging account typ
ArtLine
Volodymyr Zubov
ArtLine is a scalping fully automatic trading robot. It uses several digital indicators and its own filters to find suitable market conditions. For currency pairs with the Swiss franc, the most positive trading results. Recommended trading pair EURCHF M1 The EA works on the candlestick opening prices, this provides a reliable test on historical data and stable operation in real conditions. Stop Loss and Take Profit are always used to protect the deposit . You only need to set up an acceptab
SpectorChart
Sergii Krasnyi
5 (1)
This indicator continuously changes the color of candlestick borders and bodies, as well as the color of volumes in real time. The indicator is easy to use. The palette of colors is diverse. This product is a graphical solution, so it is difficult to describe what it does by text, it is easier to see by downloading it, besides the product is free. The indicator is suitable for bloggers who want to create a beautiful picture of a chart for video editing or traders who want to make their chart al
FREE
Fisher Steels
Ivan Simonika
The   Fisher Steel  bot implements the maximum of the HFT definitions. The expert system goes through the entire history and all currency pairs with a single setting. If there is a commission on the account, it must be converted into the equivalent of the spread and fill in the Commission field. Both virtual and real stop losses are used. Normal working conditions: The lower the commission and the spread, the greater the profit. The more latency your broker has in the amount of the Internet c
Scanner Trend Indy
Suriya Thammalungka
A trend indicator based on the Ichimoku Kinko Hyo and Candlestick. The Scanner Trend Indy is an improved variant of the Ichimoku Kinko Hyo and Candlestick, which shows the moment of trend following quite accurately. It is often used as a signal filter. Combination of two indicators makes a better use of these advantages: Ichimoku Kinko Hyo identifies the trend, while Candlestick determines the short-term movements and signals in the trend direction. Messages/sounds (notifications and sound set
GFSupportMA
Jozsef Lakatos
English : A GF_support+MA.mq4 indikátor átfogó eszközként szolgál a kereskedési döntések támogatására a MetaTrader 4 platformon. Fő funkciója, a LookBackPeriod beállítás lehetővé teszi a kereskedők számára, hogy beállítsák a támogatási és ellenállási szintek kiszámításához használt időszak hosszát. Ez a paraméter határozza meg az elemzési periódus hosszát a gyertyákban, ami döntő fontosságú a piaci csúcsok és mélypontok azonosításához, ezáltal pontosan megrajzolja a támasz- és ellenállásvonala
FREE
Pixy Plus
Osama Hussein
A sophisticated trend change indicator with additional filters to cherry pick trades. Also includes genuine statistics and ground-breaking automatic optimization. The indicator does not repaint but doesn't calculates stop loss and take profit. We Follow the trend depending on special formula plus price action The statistics explain all important information most trader need it.consideration spread, the last three days can be shown together with results at the charts and ordered/ranked by profita
No parameters Risk index:          Income index:         This product is similar to Martin's system plus random factor, and the program budget 1% profit every day. If not, it will accumulate to the next day; The number of hands on the next day will be increased accordingly. In the test, I used $1000 as the base to start running, and the effect doubled in two months; The overall concept of risk and profit are the same; But because of this, the stability of profit is relativel
Carry Hedge Ai Robot
Nirundorn Promphao
I will support only my client. สำหรับลูกค้า Carry Hedge Ai Robot with Current TF, Auto Trading, Current Chart, Any Asset Pairs, Any Brokers located time GMT+2, GMT+3, UTC+2, UTC3, not included Exness broker He can recovery with level martingale and compare the position win and loss direction. Level 2 Steps Martingale and Hedging Duos position (Long and Short), No more indicator. For martingale step you can set via your money management and frequency trading too. Example1 No martingale   bala
Meta Treand
Tatiana Savkevych
Forex Meta Trend indicator - using the built-in algorithm allows you to determine the current trend. You can quickly understand what kind of trend is currently developing in the market. The indicator projects one of the main market wisdoms and says - "The trend is my friend". Using this indicator, you can develop a trading system in the financial markets. Since the indicator is designed specifically to create a system for searching for a market trend. This indicator does not lag and shows the tr
Speciarised MT4 EA for USDJPY. This expert advisor's strategy follows trends and effective in trending market. Setting is just simple and easy because the parameters are already adjusted only one market. Only one manual setting parameter is trading lot. This EA's loss cut range is 1 yen. I recommend loss in one time shoud be under five percents of balance on your account. How to Setup  Press "File" tab and "Open data folder". Drop "USDJPY Dragon.ex4" to MQL4 -> Exparts folder. Attach EA to
EMA Dashboard
Chantal Sala
1 (1)
Ema Dashboard is an innovative dashboard that allows you to monitor Moving Average on multiples symbols and different timeframes. This dashboard allows you to analyze information on 28 pairs on an unique chart. Its functionality includes analysis of All Time Frames. This configuration allows you to identify the Long Term Trend with extreme ease. This panel allows you to take very important directional movements. A click on button opens a new chart (symbol and timeframe). Graphic Object Symbol
Fimathe Mt4
Mario Miguel Marques Vara
5 (1)
Automate Your Fimathe MT4 Strategy - Trade with Efficiency and Precision Description: The Fimathe Strategy is widely recognized for its profitability but is also known for requiring long hours of market monitoring. To address this issue, we introduce Fimathe MT4, a robot that automates the execution of your strategy. How It Works: Fimathe MT4 operates in "semiautomatic" mode. You conduct your analysis, and the robot executes trades based on it. Advantages: Eliminate the need to wait for ho
Momentum Classic
Ivan Pochta
3.95 (22)
Momentum Classic Live results:   https://www.mql5.com/en/signals/579509 Momentum Classic   is a completely automatic trading EA. It is a fact that market is mostly trading in range and high-power bursts are rare. These sharp movements are starting with momentum, which is a signal to trend start, increased volatility and trading volumes. We built a special algo, which seeks for such  Impulse  (Momentum) , to signal trade entry.  Momentum Classic  also has several filters, based on deviation fr
GoldSSS
Ilia Serov
The robot was designed to work with gold on a 15-minute timeframe. It is easily optimized to work on all spot market instruments. But since gold has a large intraday trading range, it is optimal to use a robot to work with gold. It can be optimized for any timeframe. To work with currency pairs on accounts with 5 decimal places, the trailing stop and step must be multiplied by 10. Trailing stop allows you to take almost the entire price momentum.
Introducing CybeCore EA - a cutting-edge Forex trading advisor that utilizes an innovative strategy based on fully-transformers without decoders, operating on the foundation of the CyberVision EA advisor. What sets CybeCore EA apart from CyberVision EA is its ability to analyze data with unprecedented accuracy and speed, achieved through the application of advanced machine learning techniques. CybeCore EA employs a decoder-less architecture, significantly enhancing the efficiency of its trading
Buyers of this product also purchase
TPSpro RFI Levels
Roman Podpora
4.85 (20)
Reversal First Impulse levels (RFI)    INSTRUCTIONS        RUS       -       ENG              R ecommended to use with an indicator   -   TREND PRO -  Version MT5 A key element in trading is zones or levels from which decisions to buy or sell a trading instrument are made. Despite attempts by major players to conceal their presence in the market, they inevitably leave traces. Our task was to learn how to identify these traces and interpret them correctly. Main functions: Displaying active zones
Atomic Analyst
Issam Kassas
5 (3)
First of all Its worth emphasizing here that this Trading Indicator is   Non-Repainting , Non Redrawing and Non Lagging Indicator   Indicator, Which makes it ideal from both manual and robot trading.  User manual: settings, inputs and strategy . The Atomic Analyst  is a PA Price Action Indicator that uses Strength and Momentum of the price to find a better edge in the market. Equipped with Advanced filters which help remove noises and false signals, and Increase Trading Potential. Using Multipl
TPSproTREND PrO
Roman Podpora
4.78 (18)
TPSpro TRENDPRO  - is a trend indicator that automatically analyzes the market and provides information about the trend and each of its changes, as well as giving signals for entering trades without redrawing! The indicator uses each candle, analyzing them separately. referring to different impulses - up or down impulse. Exact entry points into transactions for currencies, crypto, metals, stocks, indices!  -  Version MT5               DETAILED DESCRIPTION                R ecommended to use with
CURRENTLY 26% OFF Best Solution for any Newbie or Expert Trader! This Indicator is a unique, high quality and affordable trading tool because we have incorporated a number of proprietary features and a new formula. With only ONE chart you can read Currency Strength for 28 Forex pairs! Imagine how your trading will improve because you are able to pinpoint the exact trigger point of a new trend or scalping opportunity? User manual: click here That's the first one, the original! Don't buy a worthle
Scalper Inside PRO
Alexey Minkov
4.74 (58)
An exclusive indicator that utilizes an innovative algorithm to swiftly and accurately determine the market trend. The indicator automatically calculates opening, closing, and profit levels, providing detailed trading statistics. With these features, you can choose the most appropriate trading instrument for the current market conditions. Additionally, you can easily integrate your own arrow indicators into Scalper Inside Pro to quickly evaluate their statistics and profitability. Scalper Inside
Advanced Supply Demand
Bernhard Schweigert
4.92 (313)
CURRENTLY 26% OFF !! Best Solution for any Newbie or Expert Trader! This indicator is a unique, high quality and affordable trading tool because we have incorporated a number of proprietary features and a new formula. With this update, you will be able to show double timeframe zones. You will not only be able to show a higher TF but to show both, the chart TF, PLUS the higher TF: SHOWING NESTED ZONES. All Supply Demand traders will love it. :) Important Information Revealed Maximize the potenti
Currently 20% OFF ! Best Solution for any Newbie or Expert Trader! This dashboard software is working on 28 currency pairs plus one. It is based on 2 of our main indicators (Advanced Currency Strength 28 and Advanced Currency Impulse). It gives a great overview of the entire Forex market plus Gold or 1 indices. It shows Advanced Currency Strength values, currency speed of movement and signals for 28 Forex pairs in all (9) timeframes. Imagine how your trading will improve when you can watch the e
FX Volume
Daniel Stein
4.6 (35)
Visit our all-new   Stein Investments Welcome Page   to get the latest information, updates and trading strategies. FX Volume is the FIRST and ONLY volume indicator that provides a REAL insight into the market sentiment from a broker's point of view. It provides awesome insights into how institutional market participants, like brokers, are positioned in the Forex market, much faster than COT reports. Seeing this information directly on your chart is the real game-changer and breakthrough solut
Enigmera
Ivan Stefanov
5 (3)
ENIGMERA: The core of the market (If the demo of mql5.com doesn't working and you want to try Enigmera please message me.) Introduction This indicator and trading system is a remarkable approach to the financial markets . ENIGMERA uses the fractal cycles to accurately calculate support and resistance levels. It shows the authentic accumulation phase and gives direction and targets.  A system that works whether we are in a trend or a correction.   How does it operate? ENIGMERA comprises of fol
FX Power MT4 NG
Daniel Stein
5 (11)
Trading GOLD, and currencies, with the dog walk strategy  - super smart Trading GOLD, and currencies, with the breakout strategy  - super easy Visit our all-new   Stein Investments Welcome Page   to get the latest information, updates and trading strategies. FX Power MT4 NG  is the next generation of our long-time very popular currency strength meter, FX Power.  And what does this next-generation strength meter offer? Everything you have loved about the original FX Power  PLUS GOLD/XAU stre
GOLD Impulse with Alert
Bernhard Schweigert
4.56 (9)
This indicator is a super combination of our 2 products  Advanced Currency IMPULSE with ALERT  and  Currency Strength Exotics . It works for all time frames and shows graphically impulse of strength or weakness for the 8 main currencies plus one Symbol! This Indicator is specialized to show currency strength acceleration for any symbols like Gold, Exotic Pairs, Commodities, Indexes or Futures. Is first of its kind, any symbol can be added to the 9th line to show  true currency strength accelerat
TakePropips Donchian Trend Pro
Eric John Pajarillaga Aldana
4.82 (17)
TakePropips Donchian Trend Pro  (MT4) is a powerful and effective tool that automatically detects the direction of the trend using the Donchian Channel and provides you with an entry and exit trading signals! This multi-function indicator includes a trend scanner, trading signals, statistical panel, screener, trading sessions, and alerts history dashboard. It is designed to provide you with trading signals and save you hours analyzing the charts! You can download the user manual and installation
ON Trade Optuma Astro
Abdullah Alrai
5 (4)
This is an astronomy indicator for the MT4 platform like optuma program that performs a variety of functions. It uses complex algorithms to perform its own calculations, which are so accurate. The indicator has a panel that provides astronomical information such as planets' geo/heliocentric cords, distance of sun/earth, magnitude, elongation, constellation, ecliptic cords, equatorial cords, and horizontal cords depending on  the vertical line that generated by the indicator depend on the time va
Please send me Direct message on MQL5 CHAT after purchasing the Indicator for Training and Installation Support There are some additional files that is important to use with the Indicator . So be sure to contact me after purchasing the Indicator So that I can add you for training and support . If you find any difficulty with installation then send me Direct message here So that I can connect with you via Anydesk or Teamview for the product installation. " Smart Order Block Indicator " to find
Currency Strength Exotics
Bernhard Schweigert
4.88 (33)
CURRENTLY 20% OFF ! Best Solution for any Newbie or Expert Trader! This Indicator is specialized to show currency strength for any symbols like Exotic Pairs Commodities, Indexes or Futures. Is first of its kind, any symbol can be added to the 9th line to show true currency strength of Gold, Silver, Oil, DAX, US30, MXN, TRY, CNH etc. This is a unique, high quality and affordable trading tool because we have incorporated a number of proprietary features and a new formula. Imagine how your trading
ECM Channel MT4
Paulo Rocha
5 (1)
ECM Elite Channel is a volatility-based indicator, developed with a specific time algorithm, which consists of finding possible corrections in the market. This indicator shows two outer lines, an inner line (retracement line) and an arrow sign, where the channel theory is to help identify overbought and oversold conditions in the market. The market price will generally fall between the boundaries of the channel. If prices touch or move outside the channel, it's a trading opportunity. The
Indicator : RealValueIndicator Description : RealValueIndicator is a powerful tool designed specifically for trading on the EURUSD pair. This indicator analyzes all EUR and USD pairs, calculates their real currency strength values, and displays them as a single realistic value to give you a head start on price. This indicator will tell you moves before they happen if you use it right. RealValueIndicator allows you to get a quick and accurate overview of the EURUSD currency pair tops and bottoms,
Advanced Currency IMPULSE with ALERT
Bernhard Schweigert
4.91 (495)
CURRENTLY 31% OFF !! Best Solution for any Newbie or Expert Trader! This indicator is a unique, high quality and affordable trading tool because we have incorporated a number of proprietary features and a secret formula. With only ONE chart it gives Alerts for all 28 currency pairs. Imagine how your trading will improve because you are able to pinpoint the exact trigger point of a new trend or scalping opportunity! Built on new underlying algorithms it makes it even easier to identify and confir
Up down v6T
Guner Koca
5 (1)
Thise indicator is up down v6  comes with tradingwiev pinescript. purchased people, after installed on terminal ,contact me on mql5  to get BONUS  TradingView pinescript. up-down indicator is no repaint and works all pairs and lower than weekly time frames charts. it is suitable also 1 m charts for all pairs. and hold long way to signal. dont gives too many signals. when red histogram cross trigger line that is up signal.and price probably will down when blue histogram cross trigger line that
Introduction to X3 Chart Pattern Scanner X3 Cherart Pattern Scanner is the non-repainting and non-lagging indicator detecting X3 chart patterns including Harmonic pattern, Elliott Wave pattern, X3 patterns, and Japanese Candlestick patterns. Historical patterns match with signal patterns. Hence, you can readily develop the solid trading strategy in your chart. More importantly, this superb pattern scanner can detect the optimal pattern of its kind. In addition, you can switch on and off individu
TrendMaestro
Stefano Frisetti
5 (3)
note: this indicator is for METATRADER4, if you want the version for METATRADER5 this is the link:  https://www.mql5.com/it/market/product/108106 TRENDMAESTRO ver 2.4 TRENDMAESTRO recognizes a new TREND in the bud, he never makes mistakes. The certainty of identifying a new TREND is priceless. DESCRIPTION TRENDMAESTRO identifies a new TREND in the bud, this indicator examines the volatility, volumes and momentum to identify the moment in which there is an explosion of one or more of these data a
XQ Indicator MetaTrader 4
Marzena Maria Szmit
3.67 (3)
Step into the realm of Forex trading with confidence and precision using XQ, a cutting-edge Forex indicator designed to elevate your trading game to unprecedented heights. Whether you're a seasoned trader or just stepping into the world of currency exchange,   XQ Forex Indicator   empowers you with the insights and signals needed to make informed trading decisions. The signal conditions are a combination of three indicators, and XQ Forex Indicator only display  medium and long-term trends . The
Introducing   Quantum Trend Sniper Indicator , the groundbreaking MQL5 Indicator that's transforming the way you identify and trade trend reversals! Developed by a team of experienced traders with trading experience of over 13 years,   Quantum Trend Sniper Indicator   is designed to propel your trading journey to new heights with its innovative way of identifying trend reversals with extremely high accuracy. ***Buy Quantum Trend Sniper Indicator and you could get Quantum Breakout Indicator fo
Max Paynex
Abdulkarim Karazon
Max Payne is a reversal/trend signal indicator that gives signals in a form of an arrow, this indicator gives its signal on same bar close, this indicator can dropped multiple times on the chart with different periods to get double/triple confirmation of signals the indicator is highly adjustable to fit any trading style while it never repaints or back paint, you will get the full system shown in screenshots after purchase along side used templates. ----------------- How to trade : wait until y
Gold Channel is a volatility-based indicator, developed with a specific timing algorithm for the XAUUSD pair, which consists of finding possible corrections in the market. This indicator shows two outer lines, an inner line (retracement line) and an arrow sign, where the theory of the channel is to help identify overbought and oversold conditions in the market. The market price will generally fall between the boundaries of the channel. If prices touch or move outside the channel it is a tra
SNR LEVEL INDICATOR Accurate Snr level indicator will only display Fresh Levels that are close to the Current Market Price. This indicator is very accurate in mapping Support & resistance levels. there is an alert feature when the price TOUCHES the SNR LEVEL, WHEN CLOSE CANDLE BREAK/REJECT SNR LEVEL. INDICATOR MARKING :: - SUPPORT LEVEL == V SHAPE - RESISTANCE LEVEL == APEX LEVEL - GAP RESISTANCE & GAP SUPPORT == OPEN CLOSE CANDLE - SUPPORT BECAME RESISTANCE & RESISTANCE BECAME SUPPORT INDIC
All in One Trade
Alexey Minkov
4.48 (27)
The All-in-One Trade Indicator (AOTI) determines daily targets for EURUSD, EURJPY, GBPUSD, USDCHF, EURGBP, EURCAD, EURAUD, AUDJPY, GBPAUD, GBPCAD, GBPCHF, GBPJPY, AUDUSD, and USDJPY. All other modules work with any trading instruments. The indicator includes various features, such as Double Channel trend direction, Price channel, MA Bands, Fibo levels, Climax Bar detection, and others. The AOTI indicator is based on several trading strategies, and created to simplify market analysis. All-in-One
Blahtech Market Profile
Blahtech Limited
4.61 (18)
Was: $249  Now: $99   Market Profile defines a number of day types that can help the trader to determine market behaviour. A key feature is the Value Area, representing the range of price action where 70% of trading took place. Understanding the Value Area can give traders valuable insight into market direction and establish the higher odds trade. It is an excellent addition to any system you may be using. Blahtech Limited presents their Market Profile indicator for the MetaTrader community. Ins
Volatility Trend System - a trading system that gives signals for entries. The volatility system gives linear and point signals in the direction of the trend, as well as signals to exit it, without redrawing and delays. The trend indicator monitors the direction of the medium-term trend, shows the direction and its change. The signal indicator is based on changes in volatility and shows market entries. The indicator is equipped with several types of alerts. Can be applied to various trading
NAM Order Blocks
NAM TECH GROUP, CORP.
5 (1)
MT4 Multi-timeframe Order Blocks detection indicator. Features - Fully customizable on chart control panel, provides complete interaction. - Hide and show control panel wherever you want. - Detect OBs on multiple timeframes. - Select OBs quantity to display. - Different OBs user interface. - Different filters on OBs. - OB proximity alert. - ADR High and Low lines. - Notification service (Screen alerts | Push notifications). Summary Order block is a market behavior that indicates order collection
More from author
Scalper Assistant MT5
Pavel Verveyko
3.67 (3)
The indicator is a trading system for short-term trading. Scalper Assistant helps to determine the direction of the transaction, and also shows the entry and exit points. The indicator draws two lines (possible points for opening positions). At the moment of the breakdown of the upper line up (and when all trading conditions are met), an up arrow appears (a buy signal), as well as 2 goals. At the moment of the breakdown of the lower line down (and when all trading conditions are met), a do
The indicator displays the key support and resistance levels on the chart. The significance of these levels lies in that the price may reverse or strengthen the movement when passing such levels, since they are formed as a consequence of the natural reaction of market participants to the price movement, depending on which positions they occupied or did not have time to occupy. The psychology of the level occurrence: there always those who bought, sold, hesitated to enter or exited early. If the
Turn
Pavel Verveyko
The indicator shows the market turning points (entry points). Reversals allow you to track rebound/breakout/testing from the reverse side of the lines of graphical analysis or indicators. Reversals can be an independent signal. The indicator allows you to determine reversals taking into account the trend and without it. You can choose a different period for the movement preceding the reversal, as well as the volatility coefficient. When plotting reversals, the indicator takes into account vola
Length Movement
Pavel Verveyko
5 (2)
Measures the length of the selected movement in points, shows the duration of the movement, as well as the speed of movement.   Outputs the average value of each dimension. It is designed to calculate the expected target based on typical market movements. The intended goal will provide information about the ratio of the stop size to the possible profit and will allow you not to open positions with a small expected profit. It will also help you determine the point at which it is more logical t
The indicator allows you to quickly switch from one instrument to another, from one time period to another using the keyboard or buttons on the monitor. Each command can be assigned a hot key from 0-9, a-Z (case-insensitive) and VK_OEM_COMMA ("<" on the keyboard) and VK_OEM_PERIOD (">" on the keyboard). This can help you to operate the maximum number of instruments that are available at your broker, analyze more instruments/periods in less time. This product cannot be tested in the tester , beca
Ratio TP SL
Pavel Verveyko
5 (1)
This indicator allows you to measure the profitability of each specific transaction (the ratio of Stop and Profit). The indicator allows you to adjust the ratio by step size and number of steps. You can build an unlimited number of ratios to compare the risks from different movements. Note: in MT4, the number of horizontal lines in a single ratio cannot exceed 32. Building a line : click the " Ratio " button and draw a line (mouse click - the first point of the line, where the mouse is relea
Corporate Report
Pavel Verveyko
5 (1)
The script displays info about the share's corporate reports and dividends. The data is downloaded from   investing.com : Report date Profit per share (EPS) Revenue Market capitalization Amount of dividends Date of payment of dividends Dividend income The product cannot be tested in the tester (since it is not possible to receive data from the Internet). Before launching:  Add 2   URL   https://ru.investing.com/earnings-calendar/Service/getCalendarFilteredData  and   https://ru.investing.com/
Channel FTF
Pavel Verveyko
5 (2)
The Envelopes indicator determines the presence of a trend or flat. It has 3 types of signals, shows the probable retracement levels and levels of the possible targets. The Fibonacci coefficients are used in the indicator's calculations. Signals (generated when touching the lines or rebounding from lines): Trend - the middle line of the Envelopes has a distinct inclination; the lines below the channel's middle line are used for buy trades, the lines above the middle line and the middle line itse
Mr Big
Pavel Verveyko
The indicator shows and highlights the chart candles, which are formed as a result of large players entering the market in large volumes. Such candles can also be formed after achieving a certainty on the market, when most of the participants hold positions in the same direction. The movement is likely to continue in that direction after such candles. The indicator highlights the significant candles from the existing ones on the chart; The indicator allows identifying the trends based on candles
Splash
Pavel Verveyko
The indicator identifies the most suitable moment for entering the market in terms of market volatility, when the market has the strength to move (the signal is indicated by an arrow under the candle). For each of the signals, the presence of trends on the current and higher timeframes is determined, so that the signal is in the direction of the majority of positions opened on the market (denoted near the signal by abbreviations of timeframes with a trend present). The signal appears after the c
The indicator displays the key support and resistance levels on the chart. The significance of these levels lies in that the price may reverse or strengthen the movement when passing such levels, since they are formed as a consequence of the natural reaction of market participants to the price movement, depending on which positions they occupied or did not have time to occupy. The psychology of the level occurrence: there always those who bought, sold, hesitated to enter or exited early. If the
This indicator is a multitimeframe trading strategy. It has the levels for stop loss, take profit and entry point. The order level can also be set manually. The indicator uses the regularity of the market, which manifests itself on all instruments, and does not require adjustment of the parameters. The strategy uses a proprietary approach to determining: trend, volatility, hierarchy of timeframe significance, the size of the history period (the number of candles), which is important for making a
Trend Sync
Pavel Verveyko
5 (2)
The indicator shows the trend of 3 timeframes: higher timeframe; medium timeframe; smaller (current) timeframe, where the indicator is running. The indicator should be launched on a chart with a timeframe smaller than the higher and medium ones. The idea is to use the trend strength when opening positions. Combination of 3 timeframes (smaller, medium, higher) allows the trend to be followed at all levels of the instrument. The higher timeframes are used for calculations. Therefore, sudden change
The indicator detects important peaks and troughs (extremes) on the chart. These points can be used to plot support/resistance levels and trend lines, as well as any other graphical analysis. These points can serve as reference points for setting trading orders. The indicator does not redraw . Settings: Size_History  - the size of the calculated history. Num_Candles_Right  - number of candles to the right of the peak or trough. Num_Candles_Left  - number of candles to the left of the pea
Running along Lines
Pavel Verveyko
3.67 (3)
The indicator draws support and resistance lines on an important part of the chart for making decisions. After the trend line appears, you can trade for a breakout or rebound from it, as well as place orders near it. Outdated trend lines are deleted automatically. Thus, we always deal with the most up-to-date lines. The indicator is not redrawn . Settings: Size_History  - the size of the calculated history. Num_Candles_extremum  - the number of candles on each side of the extremum. Type_Ar
Key Volumes
Pavel Verveyko
1 (1)
The indicator shows key volumes confirmed by the price movement. The indicator allows you to analyze volumes in the direction, frequency of occurrence, and their value. There are 2 modes of operation: taking into account the trend and not taking into account the trend (if the parameter Period_Trend = 0, then the trend is not taken into account; if the parameter Period_Trend is greater than zero, then the trend is taken into account in volumes). The indicator does not redraw . Settings Histo
This trading system is based on market impulses of varying complexity.   To generate a signal, the indicator uses the moments when the direction of the pulse and the necessary section of the trend coincide. The indicator also takes into account the current market volatility. Stop_loss tags can be set with the parameter "0" or "1", then Stop_Loss will take into account market volatility.   Take_Profit tags can be set with the parameter "0", then Take_Profit will take into account market volat
Indexes
Pavel Verveyko
The stocks that make up the index are one of the drivers of the movement. Analyzing the financial performance of all elements of the index, we can assume further development of the situation. The program (script) displays corporate reports of shares that are part of the index selected in the settings.   "Indexes" cannot be tested in the tester (since there is no way to get information from the Internet). Information is downloaded from the site investing.com: Report Date Earnings per share
Fibo World
Pavel Verveyko
The indicator builds a graphical analysis based on the Fibonacci theory. Fibo Fan is used for the analysis of the impulses and corrections of the movement. Reversal lines (2 lines at the base of the Fibonacci fan) are used to analyze the direction of movements. The indicator displays the of 4 the target line in each direction. The indicator takes into account market volatility. If the price is above the reversal lines, it makes sense to consider buying, if lower, then selling. You can op
The indicator determines the state of the market: trend or flat. The state of the market is determined by taking into account volatility. The flat (trading corridor)is displayed in yellow. The green color shows the upward trend. The red color shows the downward trend. The height of the label corresponds to the volatility in the market. The indicator does not redraw . Settings History_Size   - the amount of history for calculation. Period_Candles  - the number of candles to calculate the
The indicator plots flexible support and resistance levels (dots). A special phase of movement is used for construction. Levels are formed dynamically, that is, each new candle can continue the level or complete it. The level can provide resistance or support to the price even where it is no longer there. Also, support and resistance levels can change roles. The importance of levels is affected by: the amount of time the level is formed and the number of touches. The significance of these l
The indicator is a trading system for short-term trading. Scalper Assistant helps to determine the direction of the transaction, and also shows the entry and exit points. The indicator draws two lines (possible points for opening positions). At the moment of the breakdown of the upper line up (and when all trading conditions are met), an up arrow appears (a buy signal), as well as 2 goals. At the moment of the breakdown of the lower line down (and when all trading conditions are met), a do
Gold n XAU
Pavel Verveyko
The trading system is designed to work with gold on time periods: 30M, 1H. The indicator allows you to adjust to the market situation. Parameters for 1H :   PERIOD=9F ,   FILTER=300 .   Parameters for  30M :   PERIOD=22B ,   FILTER=450 .   A small adjustment to a specific broker is allowed .   If you change the amount of history displayed, you may also need to adjust the parameters. The indicator is not redrawn.     "Gold n XAU" uses different rules for entering a trade and different ru
The indicator determines the most important component of any trading system - the possible exit point from the transaction. As the price moves, depending on the market situation, the indicator builds goals. The target becomes relevant when the price starts moving towards the target. If the movement is strong, then it may take a certain number of targets to stop or reverse price. The accumulation of targets is most likely able to stop the price. Some goals are executed several times. But the
The indicator builds "psychological levels": levels of round numbers and intermediate levels of round numbers. Round numbers play an important role in forming support and resistance levels. There is a pattern in which the decline or growth of the price can stop at round numbers. The level whose price ends at 0 is the level of a round number of the first order. Intermediate level, this is the level between two round levels, for example, between 10 and 20 this is level 15. In the " Num_Zero
The indicator displays a stock chart of a non-standard type, in which the price and time have the same value. The usual chart of Japanese candlesticks does not take into account all the information that the time analysis can give. Renko charts do not use all the information that price can give in relation to time. The "Chart Price and Time" indicator takes into account price and time equally and shows the predominance of price or time. Taking into account price and time equally gives an i
The indicator tracks sharp volatility (moments when the market has shown increased activity and movement may occur), on the selected instruments and time periods. The information is displayed as colored rectangles. Thus, it is possible to assess at a glance which tool should be given priority attention. The indicator will be useful for scalpers when they need a quick reaction or for traders working with a large number of instruments. The indicator does not redraw. The indicator displays 8 degr
This program is designed to test ideas and acquire analytical skills. The main task of the analyst is to be able to predict the direction and range on the chart, where the price should soon come. This product cannot be tested in the tester. All the functionality is shown in full in the description and screenshots. How it works : Situations for analysis are selected at random. (The more historical data, the greater the number of examples). Click " Start Game ". Between the orange vertical li
The Alert Creator indicator is designed to create alerts for selected conditions. You can select one or several indicators for the notification. If several conditions are selected, the alert is triggered when all the selected conditions are met. The signals can be configured separately for buying and separately for selling. Example, a buy alert: the closing price is above the moving average, the RSI is below 20. (In this example, 2 indicators are used to generate an alert: MA and RSI) At
The indicator determines the strength of the trend and its possible reversal points, based on the author's arithmetic approach . Each new peak or trough is a trend development. Such peaks and troughs are numbered so that the strength of the trend development can be seen. Attempts to change the trend are also numbered. This gives an understanding of a possible change in the direction of the trend. Indicator signals are generated when trying to change the trend . In the settings, it is possib
Filter:
No reviews
Reply to review
Version 1.6 2023.01.23
Minor improvements and fixes.
Version 1.5 2023.01.12
Minor bug fixed
Version 1.4 2022.12.25
The "Table_Refresh_Rate" option has been added to the settings, which allows you to set the table update interval in seconds.
Version 1.3 2022.12.24
Fixed error displaying tickers in the table. Which arose under certain rare conditions.
Version 1.2 2021.10.23
General fixes and improvements.
Version 1.1 2021.05.25
Added the ability to open a new chart with the selected template.