VolumeDeltaPercentRange
- Indicators
- Stanislav Korotky
- Version: 1.2
- Updated: 21 February 2021
- Activations: 5
This indicator provides an original mix of WPR, VSA, and volume delta. It shows ratio of buy/sell volumes scaled on 100% range based on total volume change for a selected period.
The convetional VSA (Volume Spread Analysis) studies interconnections of price action and volume change in absolute values, whereas WPR (Williams Percent Range) offers a convenient approach of price moves normalization into the fixed percentage metric: 0 - 100%.
Hence overbough and oversold states are easily spotted.
Now the new oscillator - VDPR (Volume Delta Percent Range) does the same for volume delta analysis using the following formula:
VDPR = (buy volume) / ((buy volume) + (sell volume)) * 100
where both types of volumes are accumulated separately for predefined number of recent bars.
The formula was used in past for volume wave analysis. VDPR reconsiders it for bar-wise volume delta analysis.
Algo-traders had a limited level of details about volumes in past. Specifically, quotes contained total volume per bar (in addition to OHLC), but volume delta information was missing. To overcome this limitation traders invented workarounds for volume delta analysis, such as the one based on zigzag waves, built on price. Having a zigzag, it's easy to assume that the sum of all volumes during upward edge constitutes buying volumes, whereas the sum on downward edge is the selling volumes. Hence, one can accumulate the buying and selling parts for several waves (usually collected for 5 days or more) and find an estimation of the volume delta.
This is only a rough estimation, used in past due to the lack of other, more precise methods. In reality, the volume breakdown between buyers and sellers does not follow price waves all the time. Instead, price and volume tend to show divergencies now and then, and this is considered very strong predictive signal for price reversal. Yet if you estimate volumes based on zigzag, you add artificial dependency of volumes from price, damping potential signals.
Today, algo-trading software such as MetaTrader 5 allows us to download deep tick history for every instrument (including single trade volume and direction) and build fine-grained volume delta per bar or any required interval. Moreover, using the tick-level volumes we can calculate (1) exact volume delta on every hypothetical zigzag edge and compare it with old estimation based on (2) straightforward unidirectional summation. For example, VolumeDeltaWaves indicator supports these 2 modes under the options: "signed" and "absolute" cumulative wave respectively.
Certainly, the signed accumulation preserves more info and provides more accurate results. This mode means summation of volume deltas from every bar with respect of their own sign, regardless of direction of corresponding edge. Then the sum of waves' volumes becomes equivalent to the sum of included bars' volumes. As a result, zigzag waves are not required anymore
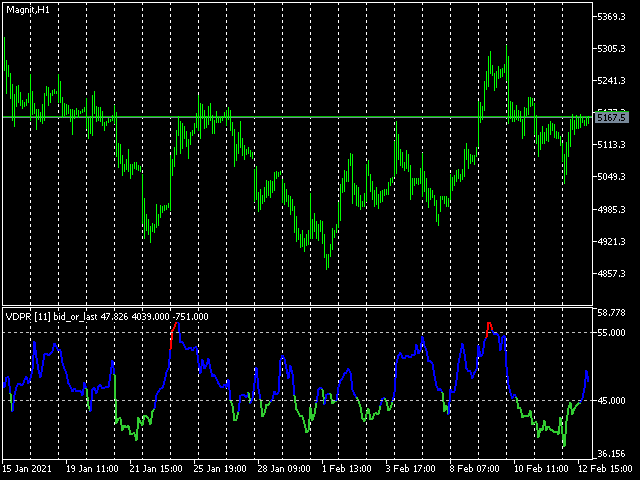
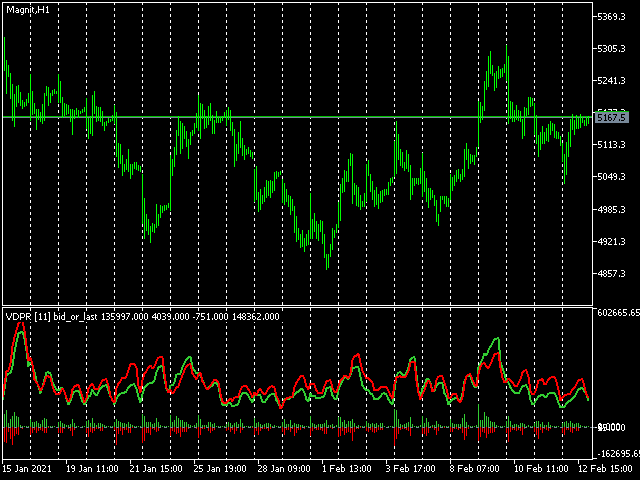
VDPR is shown as a line with 3 colors: red in upper part, green in lower part, and blue in the middle. The sections are adjusted by UpperLevel, LowerLevel parameters. As an option, VDPR can display cumulative buy and sell volumes "as is", and separate deltas per bar.
Parameters
- AccumulationPeriod - number of bars for buy/sell volume delta accumulation, 11 by default;
- TickHistoryBars - number of bars to preload tick history to process, 0 by default, which means to start from the day beginning; this parameter is important for history analysis only, because all new ticks are processed online automatically; choose large numbers with caution, because deep history of ticks may take a while to download and require additional space on the local disk;
- Method - buy/sell volume detection method: price move by only one of 2 specific price types (Ask vs Bid), middle price (Ask + Bid) change, according to tick flags (Tick Flags, applicable for exchanges only), specific price type (Bid or Last, according to chart's building) change;
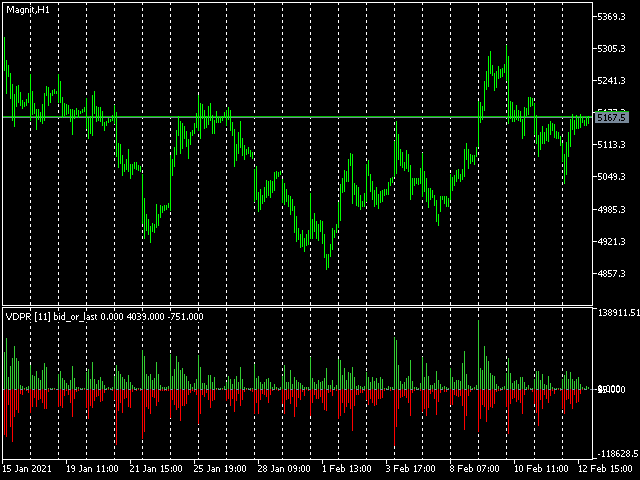
- ShowDeltaSplit - one of visualization methods: the ratio in 100% range (VDPR, by default), Cumulative Buy and Sell Volume, Buy and Sell Volume per bar;
- UpperLevel - the upper level to highlight VDPR in red - too much buys; 55 by default;
- LowerLevel - the lower level to highlight VDPR in green - too much sells; 45 by default;


