KT Candlestick Patterns MT5
- Indicators
- KEENBASE SOFTWARE SOLUTIONS
- Version: 1.1
- Activations: 5
It's true that not every candlestick pattern can be equally trusted to predict the price direction reliably. However, when combined with other technical analysis methods like Support and Resistance, they provide an exact and unfolding market situation.
KT Candlestick Patterns Scanner - A multi-symbol and multi-timeframe scanner is available that can scan the candlestick patterns on 252* combinations of symbols and time-frames from a single chart.
This indicator includes many of the candlestick patterns discussed extensively in Steve Nison's book - Japanese Candlestick Charting Techniques.
Apart from the patterns included in Steve's book, the KT Candlestick Patterns also finds many other intricate candlestick patterns that are usually not very famous among the traders.
Features
- Looking to capture fixed no. Pips on each signal, you can enter your target as the "success benchmark pips" in the inputs, the indicator will instantly find the success percentage of your chosen profit target.
- It finds 24 famous Japanese candlestick patterns with very high precision.
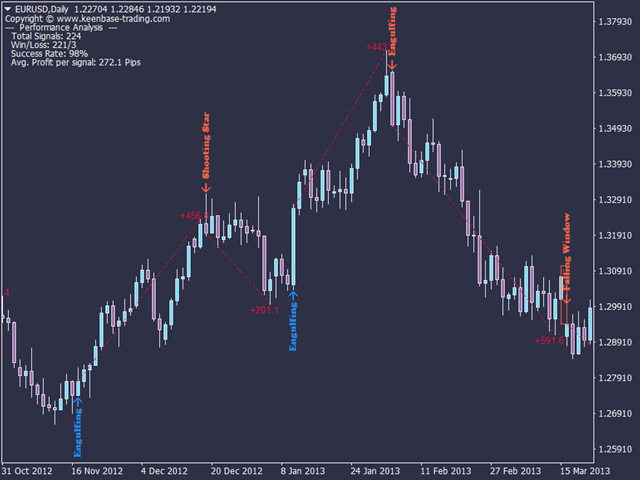
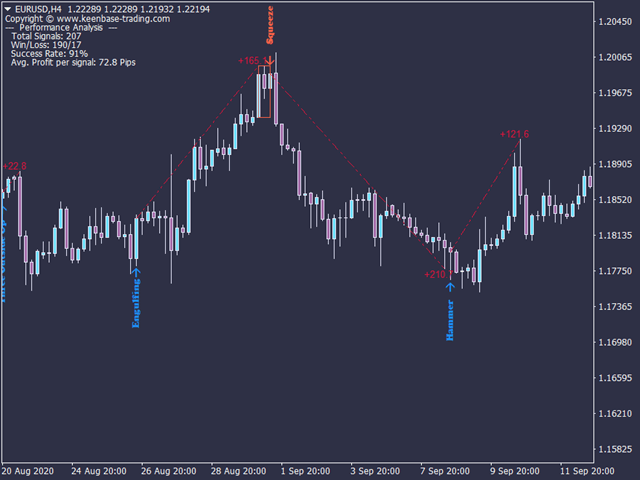
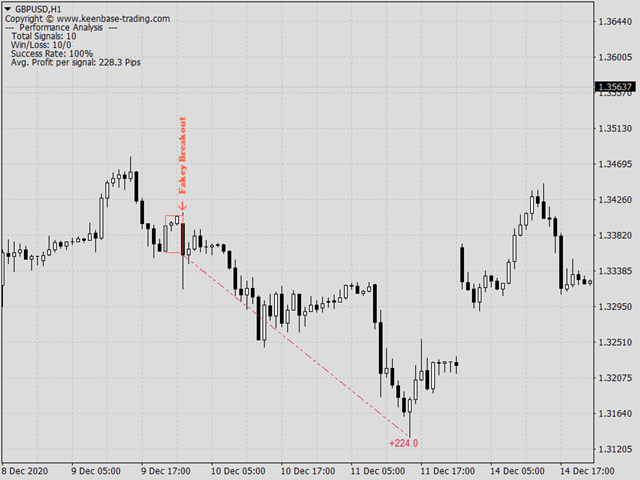
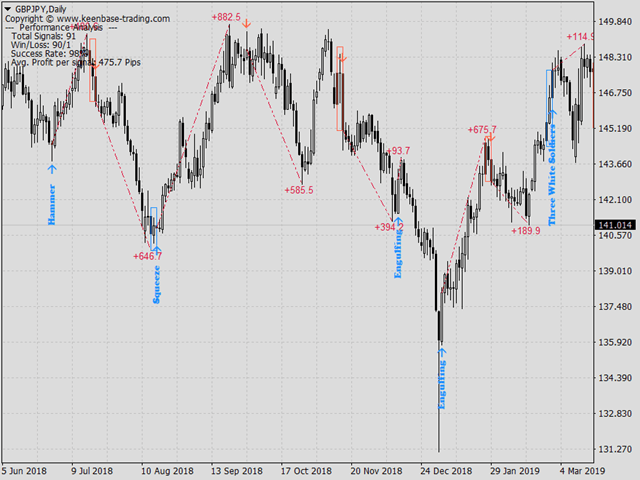
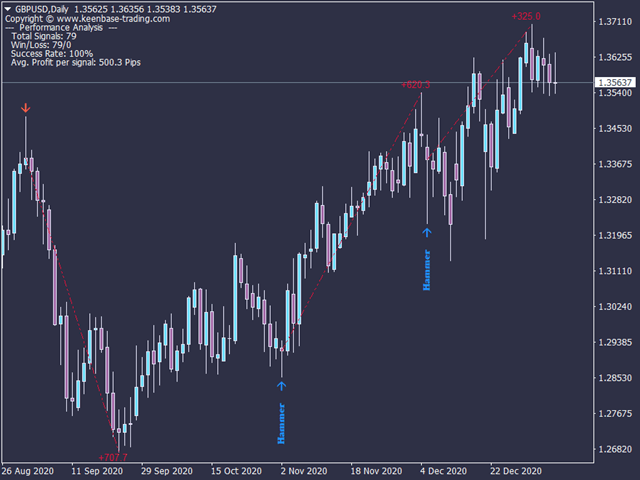
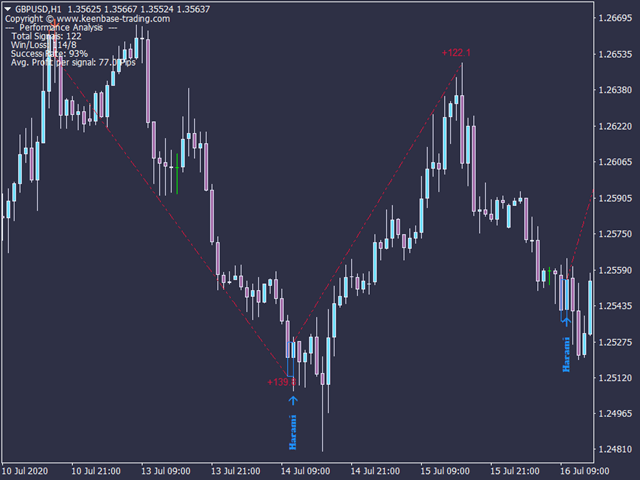
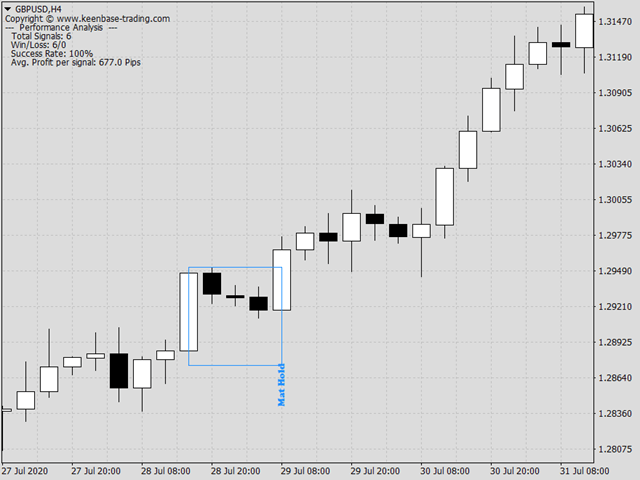
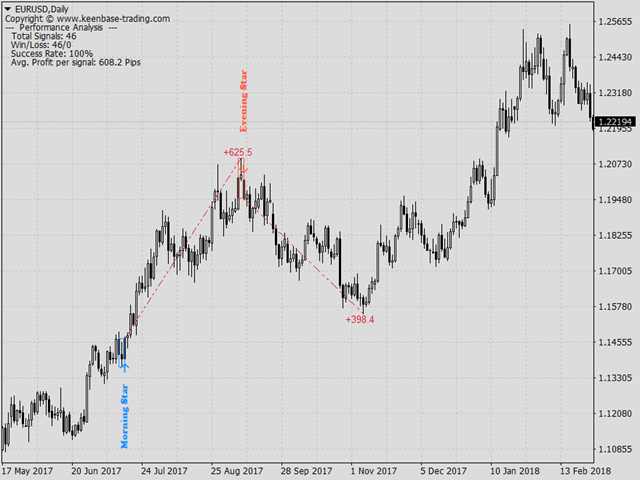
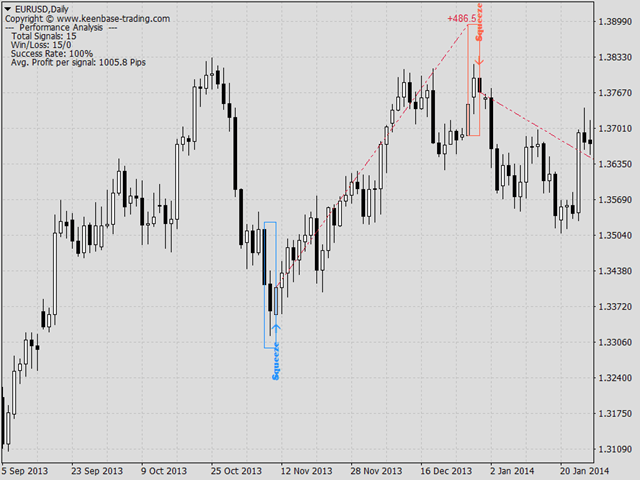
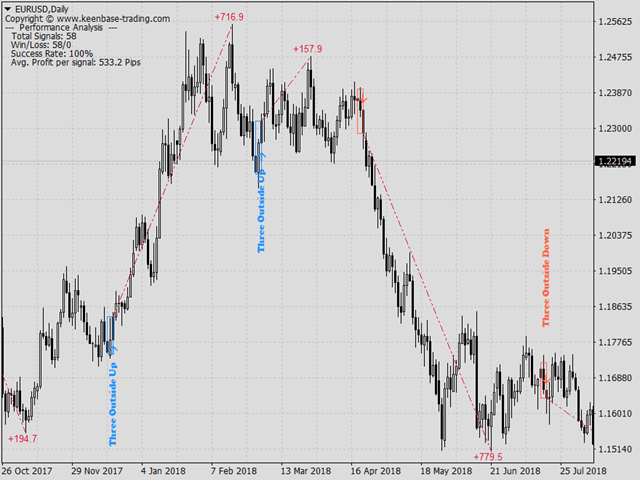
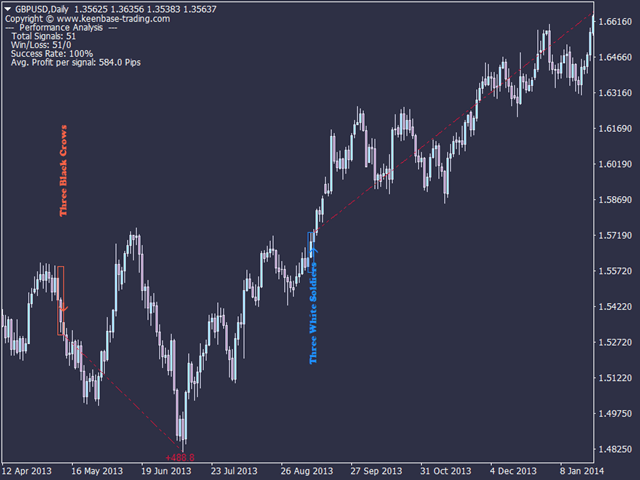
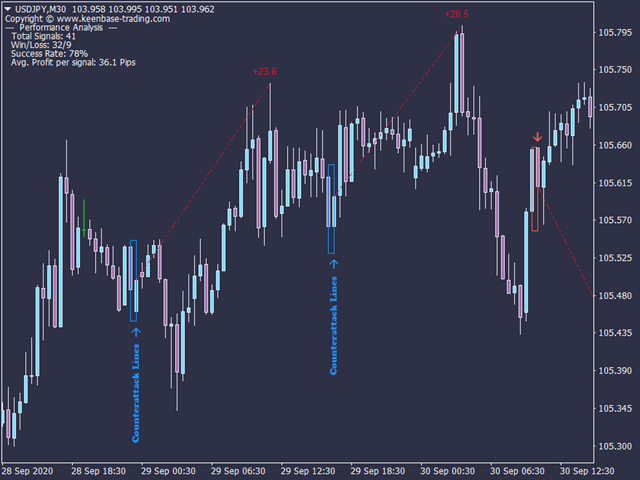
- It is equipped with a performance analysis module that tracks every candlestick pattern's accuracy and displays the statistics in real-time.
- Ability to put minimum no. of bars between each pattern that declutter the charts and improve the accuracy of the signals.
- It blends the market trend direction with pattern identification to identify the candlestick patterns more accurately.
- It includes reversal, trend continuation, and neutral patterns(Dojis).
- All Metatrader alerts included.
Included Patterns
----- Reversal Patterns -----
- Harami
- Hammer/Shooting Star
- Engulfing
- Three White Soldiers/Three Black Crows
- Three Outside Up/Down
- Three Inside Up/Down
- Morning Star/Evening Star
- Squeeze Pattern
- Belt Hold
- Dark Cloud Cover/Piercing
- Advance Block/Descent Block
- Counterattack Lines
- Ladder Bottom/Top
- Kicker
- Homing Pigeon/Descending Hawk
----- Trend Continuation Patterns -----
- Marubozu
- Rising Window/Falling Window
- Fakey Breakout
- Mat Hold
- Rising Three Method/Falling Three Method
----- Neutral Patterns -----
- Simple Doji
- Long Legged Doji
- Gravestone Doji
- Dragonfly Doji
Optimizing the Signals Accuracy
Not every candlestick pattern performs equally well. You should enable/disable the appropriate patterns for the chosen instrument and time-frame. Also, you can quickly improve the accuracy of the signals by following these simple steps:
- Make sure each pattern is set to True.
- Choose the "Success Benchmark Pips" you're looking to achieve on each signal.
- Turn-off each pattern one by one and monitor the success rate percentage.
- If turning off a particular pattern improves the success rate, keep it off.
- If turning off a particular pattern worsen the success rate, set it to True again.
- Adjust the value of "Min. Bars Between Patterns" between 10 to 50.
Increasing the value of "Min. Bars Between Patterns" will usually improve the success rate. However, a high value will significantly decrease the number of signals, so you must select a balanced value between 10 to 50.
Input Parameters
- History Bars: The number of history bars to include for the indicator buffers. Decrease the number of history bars if your PC is lagging during the use of this indicator.
- Min. Bars Between Patterns: The minimum number of bars between each pattern.
- Draw Pattern Names: Draw the pattern name of each signal.
- Patterns Selection: Enable/Disable the patterns suitable for the chosen instrument and time-frame.
- Performance Analysis: The indicator measures the accuracy of each signal and shows the essential metrics.
- Success Benchmark Pips: A success benchmark in pips to measure the success percentage of each signal.
- Show Text Analysis: Show/Hide the text information in the top left corner of the chart.



thought it was a bot but i was wrong , was looking for it to go auto trading