SR Arrows
- Indicators
- Natasha Diedericks
- Version: 1.4
- Updated: 15 June 2022
- Activations: 20
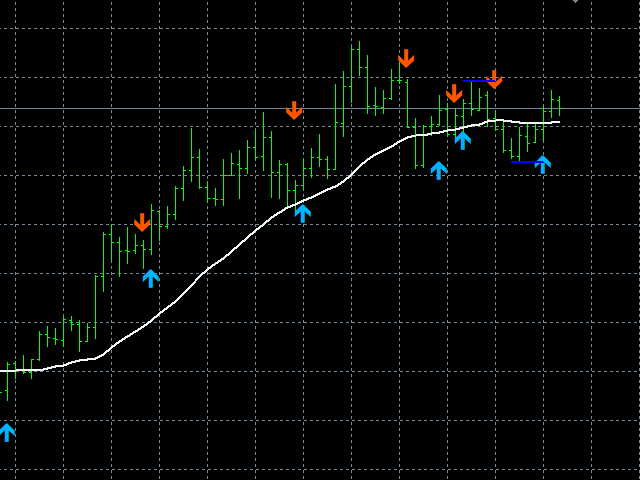
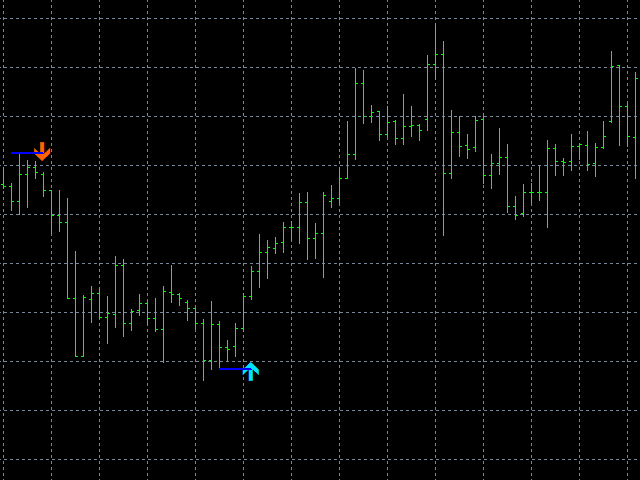
This indicator gives you arrows, two SR lines and a white trend line.
Uses a special trend algorithm to plot the arrows, combined with support and resistance inputs.
Perfect for channel trading.
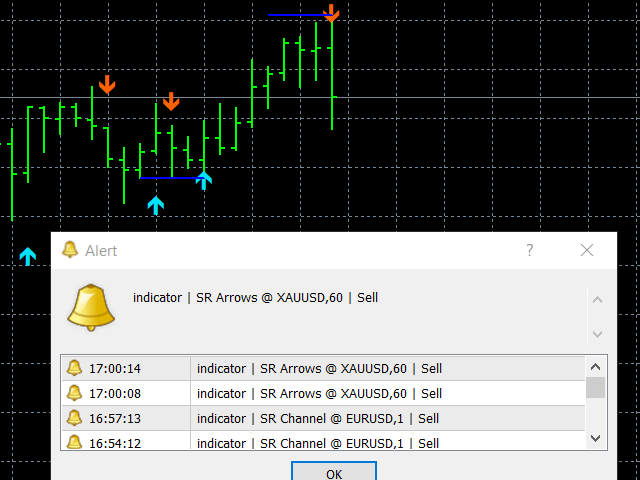
Features alert functions.
Parameter TrendArrowPeriod.
Parameter TrendLinePeriod. (Change to your preference)
How to use:
Simply attach to any chart with default settings.
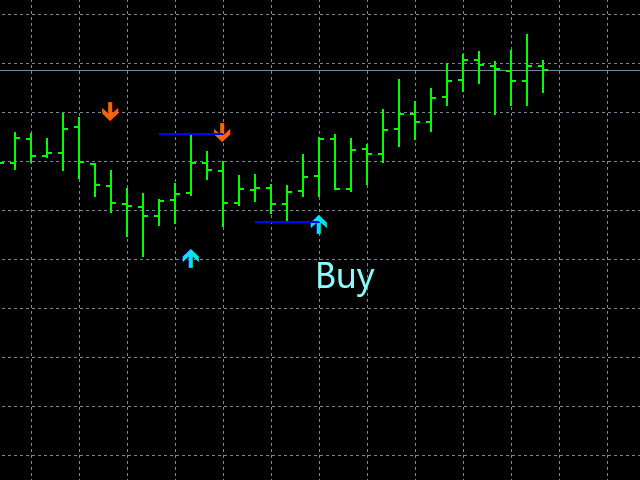
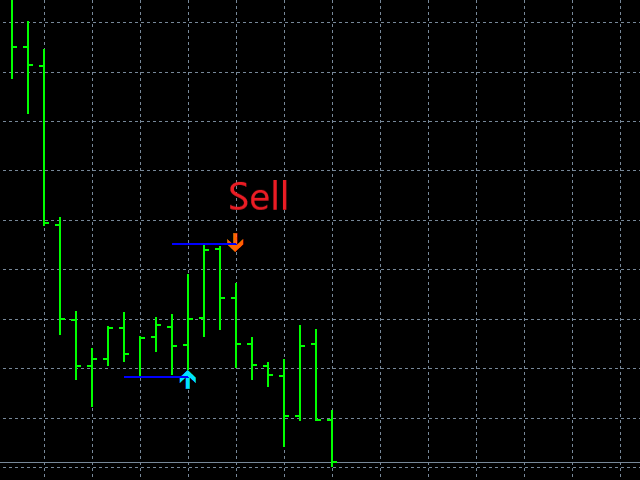
Zoom in the chart, to see the two blue SR lines and arrows more clearly.
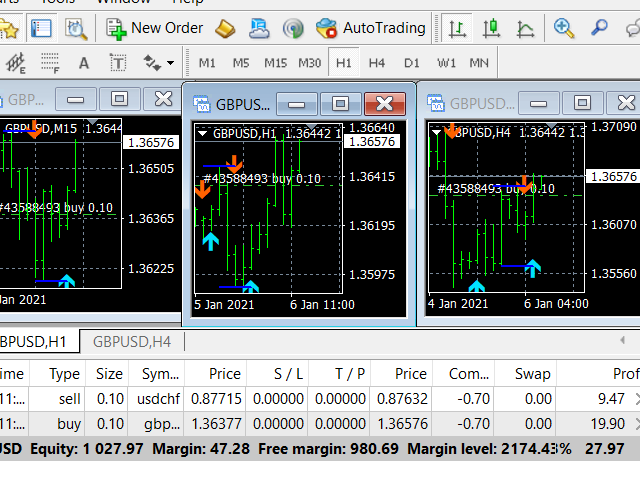
It is very important to wait for a new blue SR line to appear on the higher time frames. See below pictures for example of MTF trade set up.
When the blue SR line is below the price, white trend line is below the price and blue arrow appears, buy.
When the blue SR line is above the price, white trend line is above the price and red arrow appears, sell.
Use as you see fit for your strategy.
Best results on Major Pairs, but can also be used on other pairs.
Important to note:
-
Please do not use this indicator haphazardly. Make sure it compliments your strategy.
-
Don't risk money you cannot afford to lose.
-
You use this indicator at your own risk. Please apply money management wisely.
-
Always test your strategy on a demo account before using a new indicator on a live account.