Reversal Area Indicator
- Indicators
- Shiffolika Kapila
- Version: 4.0
- Activations: 10
REVERSAL AREA INDICATOR
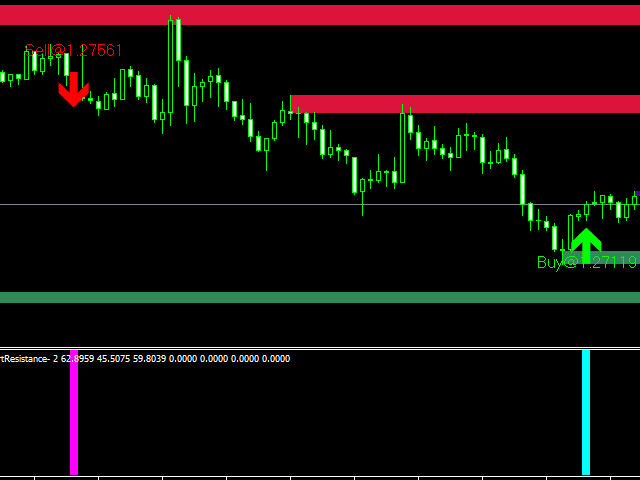
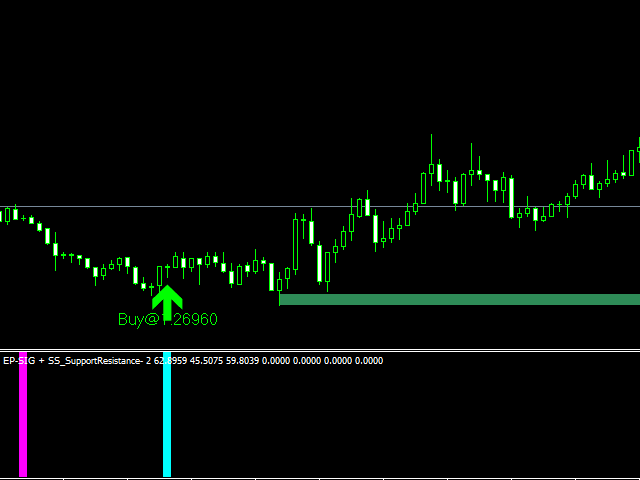
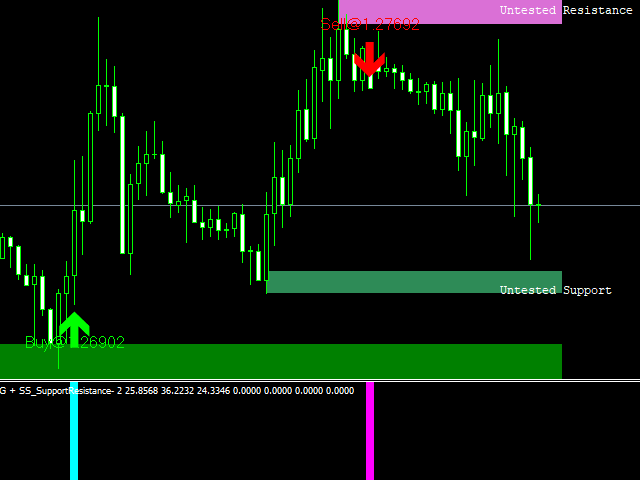
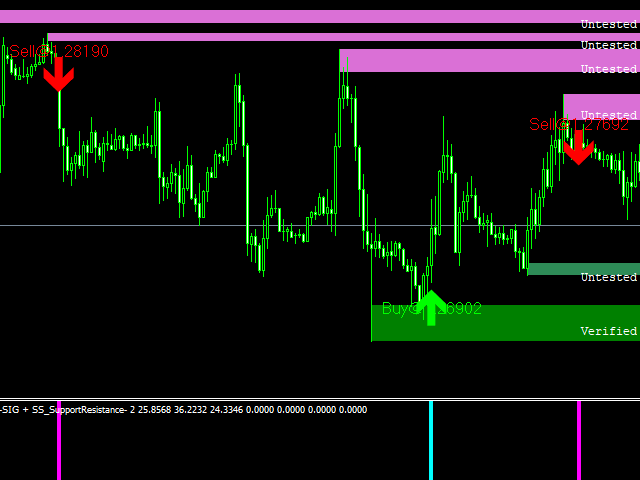
This Indicator will generate signals on top and bottom of the swings .
It will check for some support and resistance found and generate the signals at such areas.
There is high probability of the price moving in favorable directions as they are signals when there is support and resistance .
The advantage is that the entries will have small stop loss and high risk to reward ratios as they are near tops and bottoms.
1. This is an indicator that will provide logical entries,
2. Its all parameters for signals can be set as per required style of trading
3. The System Is well Optimized for 1 Minute charts and 5 Minute charts , where very few signals come , but can be used on any time frames
4. It is based on Levels as filter so The ENTRIES ARE BACKED BY ROBUST LEVELS.
5. Can provide very less signals even on highly volatile days
6. Very Good REENTRY MECHANISM - for REENTRY SIGNALS AT TREND DIRECTION
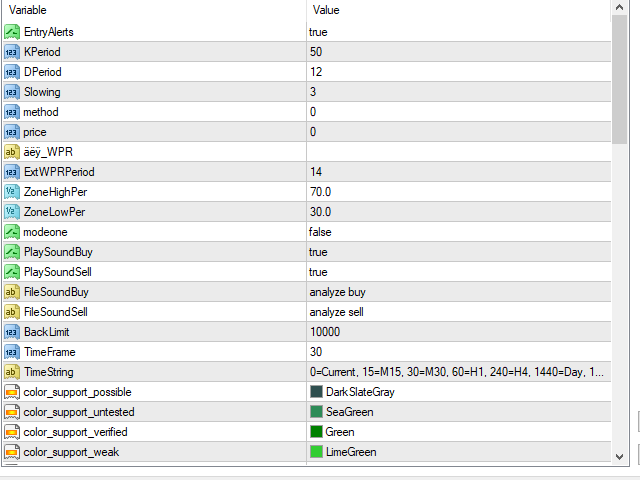
INPUTS
ENTRY SETTING PARAMETERS
EntryAlerts = true
KPeriod = 21;
DPeriod = 12;
Slowing = 3;
method = 0;
price = 0;
äëÿ_WPR = "";
ExtWPRPeriod = 14;
ZoneHighPer = 70.0;
ZoneLowPer = 30.0;
modeone = false;( BAR CLOSE )
PlaySoundBuy = true;
PlaySoundSell = true;
FileSoundBuy = "analyze buy";
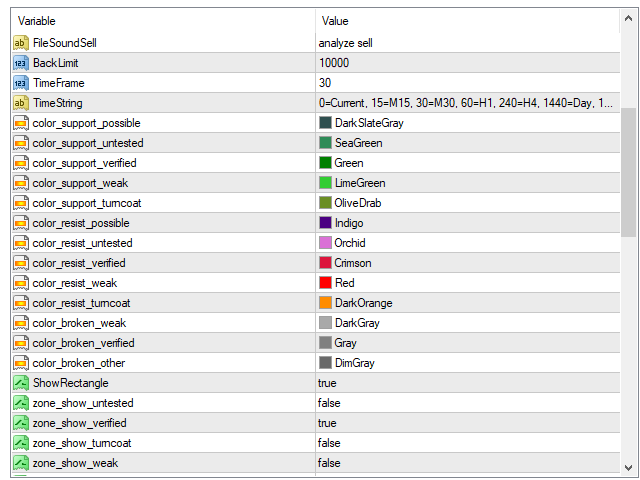
FileSoundSell = "analyze sell";
ZONE SETTINGS;
BackLimit - default is 10 000. Check the past bars for formations.
Time Frame - M15 (default is 15 min).timeframe for the zone.
M1 to Month
ZONES_COLOR;
color_support_possible - DarkSlateGray.
color_support_untested - SeaGreen.
color_support_verified - Green.
color_support_weak - LimeGreen.
color_support_turncoat - OliveDrab.
color_resist_possible - Indigo.
color_resist_untested - Orchid.
color_resist_verified - Crimson.
color_resist_weak - is Red.
color_resist_turncoat - DarkOrange.
color_broken_weak - DarkGray.
color_broken_verified - Gray.
color_broken_other - DimGray.
ShowRectangle=true ( the zone boxes of support and resistances )
SHOW_ZONES; ( AS PER SELECTION OF THE ZONE QUALITY - THE SIGNAL WILL BE SHOWING AS PER THAT )
zone_show_untested - false.
zone_show_verified - true.
zone_show_turncoat - true.
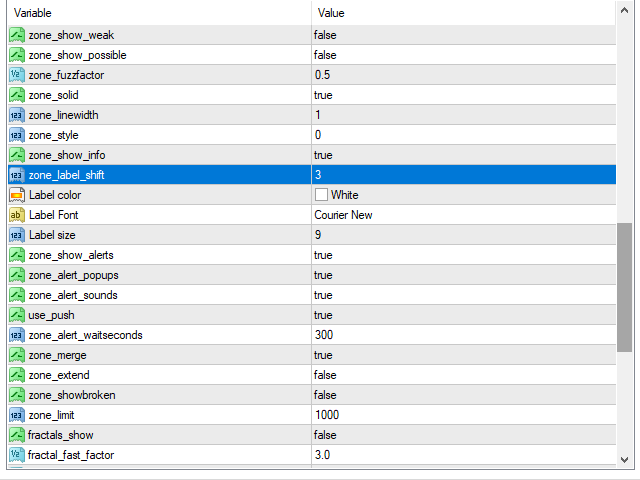
zone_show_weak - false.
zone_show_possible - true.
zone_showbroken - false.
ZONE_FRACTALS;
zone_fuzzfactor - default is 0.5.
STYLE_ZONES;
zone_merge - true. The zones get merged.
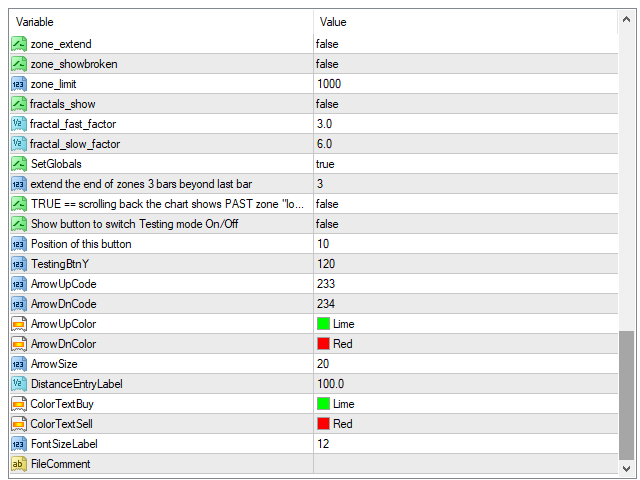
zone_extend - false. The zones will extend to the latest bars.
zone_solid - true. Fills the color.
zone_linewidth - 1. Zone thick.
zone_style - 0. zone areas.
extend the end of zones 3 bars beyond last bar - 3.
zone_limit - 1000. the zone extended limit.
zone_show_info - true. Zone statistics.
zone_show_size - true. Zone Size.
zone_label_shift - 3. text info labels.
color_label - White. Label color.
font_label - Courier New. Label font.
size_label - 9. Label size.
fractals_show - default is false. True
fractal_fast_factor - default is 3.0.
fractal_slow_factor - default is 6.0.
ZONE_ALERTS;
zone_show_alerts - true.
zone_alert_popups - true.
zone_alert_sounds - true.
send_email - false.
use_push - false.
zone_alert_waitseconds - 300. Delay set between alerts repeats.
ZONE_ALERTS_FILTER;
filter_zone_alert - true. apply the filters to the alerts.
filter_MA - true. apply the filter.
TF_MA - 60. timeframe for filtering the alerts.
MA_FAST_PERIOD - 13. Period used for the filter.
MA_FAST_METHOD - 1. like SMA, EMA, WMA.
MA_SLOW_PERIOD - 48. filter Period.
MA_SLOW_METHOD - 1.
ZONES_GLOBAL_VAR;
SetGlobals - false.
ZONES_TESTING_MODE = "==========ZONES TESTING==========";
TRUE == scrolling the chart back Displays PAST zones= false.
Show button to switch Testing mode false -
Position of this button = 10.
TestingBtnY = 120.
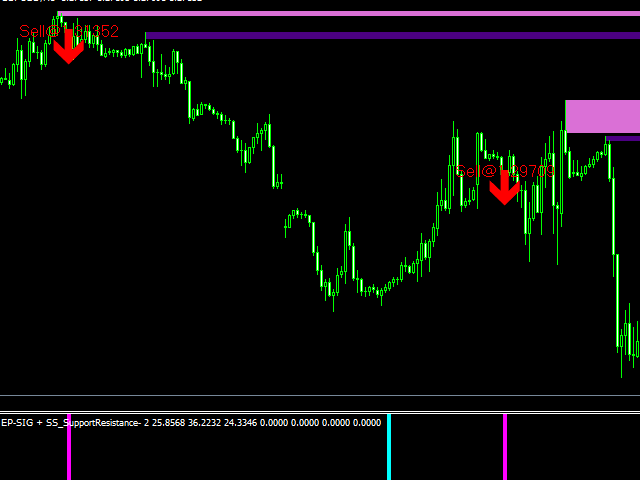

Very reliable reversal indicator... few signals but good