Market Reversal Alerts MT5
- Indicators
- LEE SAMSON
- Version: 5.0
- Updated: 5 August 2021
- Activations: 10
AUGUST SALE NOW ON - 30% OFF TILL 31ST AUGUST. WAS $49, NOW $34!
Profit from market structure changes as price reverses and pulls back.
The market structure reversal alert indicator identifies when a trend or price move is approaching exhaustion and ready to reverse. It alerts you to changes in market structure which typically occur when a reversal or major pullback are about to happen.
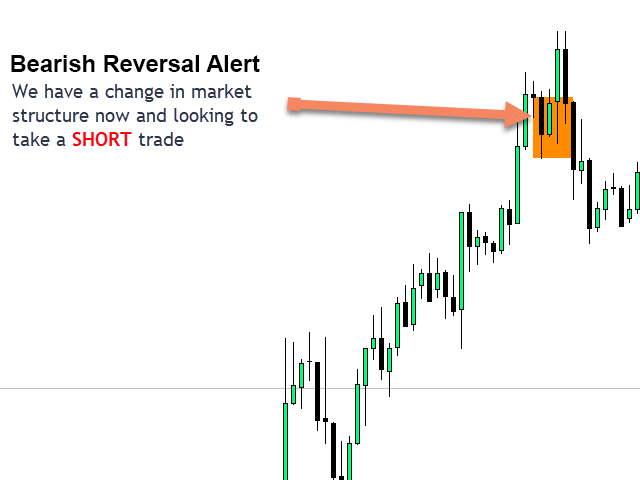
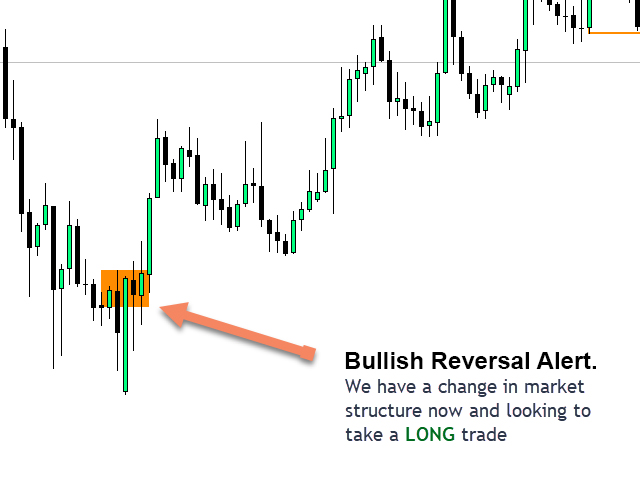
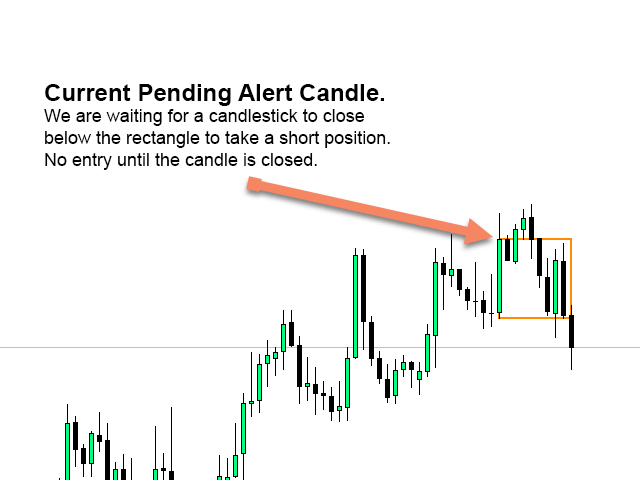
The indicator identifies breakouts and price momentum initially, every time a new high or low is formed near a possible exhaustion point. The indicator draws in a rectangle on the last opposite coloured candle. It will then trail the rectangle along with price as it continues to move in it's current short term trend. Once price weakens enough that it closes back above or below the rectangle this would indicate a potential shift in market structure is taking place. The indicator then alerts you to a potential shift in direction and the start of a possible reversal in trend or major pullback.
See the indicator in action below to see how it works!
Dashboard to monitor all pairs and major timeframes available here: https://www.mql5.com/en/market/product/65828
MT4 Version Available Here: https://www.mql5.com/en/market/product/46295/
Features
- Alerts you to potential changes in market structure at key exhaustion points
- Automatically draws in short term market structure as price approaches exhaustion levels
- Trails the alert rectangles behind price as it moves in it's current trend direction to find the tightest entries
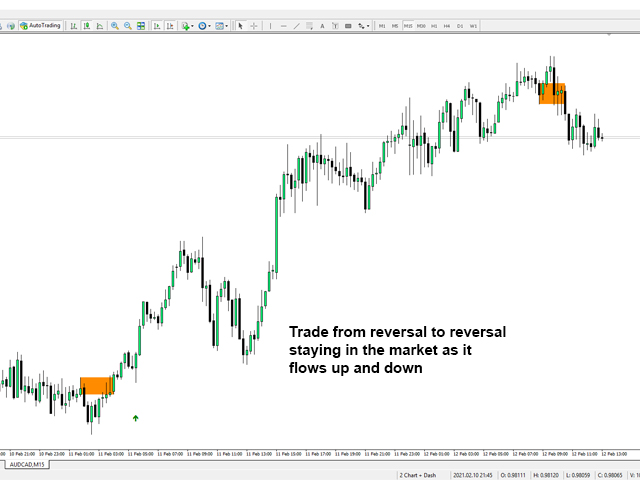
- Changes colour to a solid block rectangle on alerts to show where potential reversals in market structure have occurred
- Works on all symbols and timeframes
- Integrated pop-up, push and email alerts built in
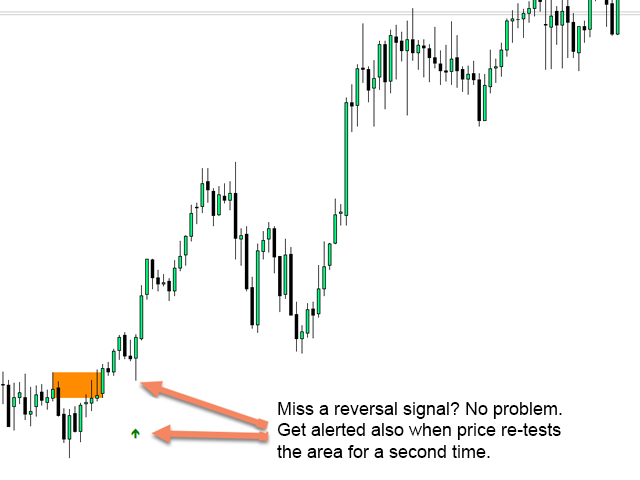
- Alerts when a re-test of a reversal alert has happened confirming the entry as being more likely
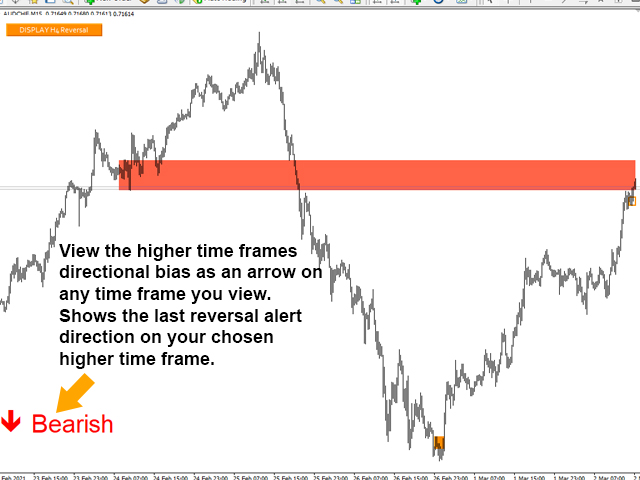
- Allows you to view higher time frame reversal rectangles on your lower trading time frame. Great for trend traders and identifying higher time frame trend direction
- Select all reversal alerts or just long or short alerts, select the directional alerts you want based on each pairs current trend direction
- View higher time frame directional bias arrow on your lower time frame chart.
Strategy & How To Trade With The Market Structure Reversal Indicator
When a reversal alert occurs:
- Look left! Is there a supply/demand or support/resistance level that we're turning at. Market structure shifts (reversals) usually occur when price is retesting an old level or a stop hunt has just happened above that support or resistance level.
- Consult a higher time frame to see if there is an area of support/resistance we are turning at. As above changes in market structure will often happen on lower time frames when at major levels on a higher time frame.
If the above conditions are met simply place a trade in the direction of the reversal.
You can add additional indicators as validation or use this indicator to add further validation to your existing indicators or strategy!
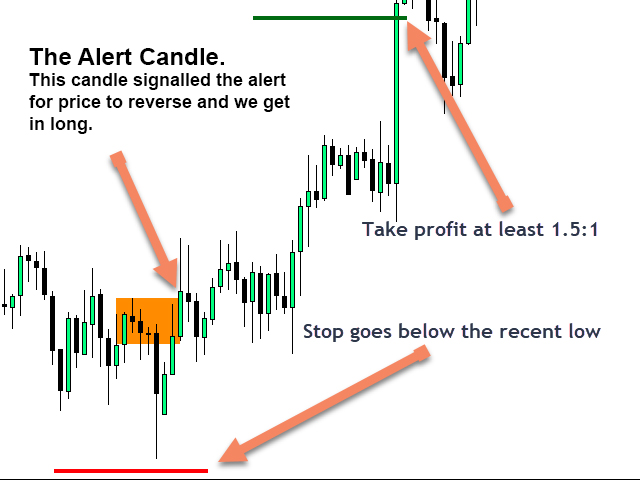
Stop Loss and Take Profit
Your stop should always go just above the most recent high or below the most recent low. If the reversal is correctly identifying a shift in market structure price will rarely move back above/below the most recent peak. The size of your stop will be dependent on how aggressive the last move to create the recent high was.
Take profit is up to the individual but using a 1.5:1 or 2:1 risk to reward is easily achievable. Entering 2 trades and having one trail along with price just above/below new rectangles as they are drawn on the chart can achieve 5:1 and higher risk reward.
Download the free demo to use in the strategy tester and see how it works.
See how big some of the moves are after the reversal alerts trigger!


If you need a holy grail trading strategy then combine this indicator with a volume profile and trade according to the reversal signal and use the volume profile shapes or patterns as confirmation. Thank me later (;)