• Overview
  • Reviews (1)
  • Comments
  • What's new

Indexes

The stocks that make up the index are one of the drivers of the movement. Analyzing the financial performance of all elements of the index, we can assume further development of the situation.
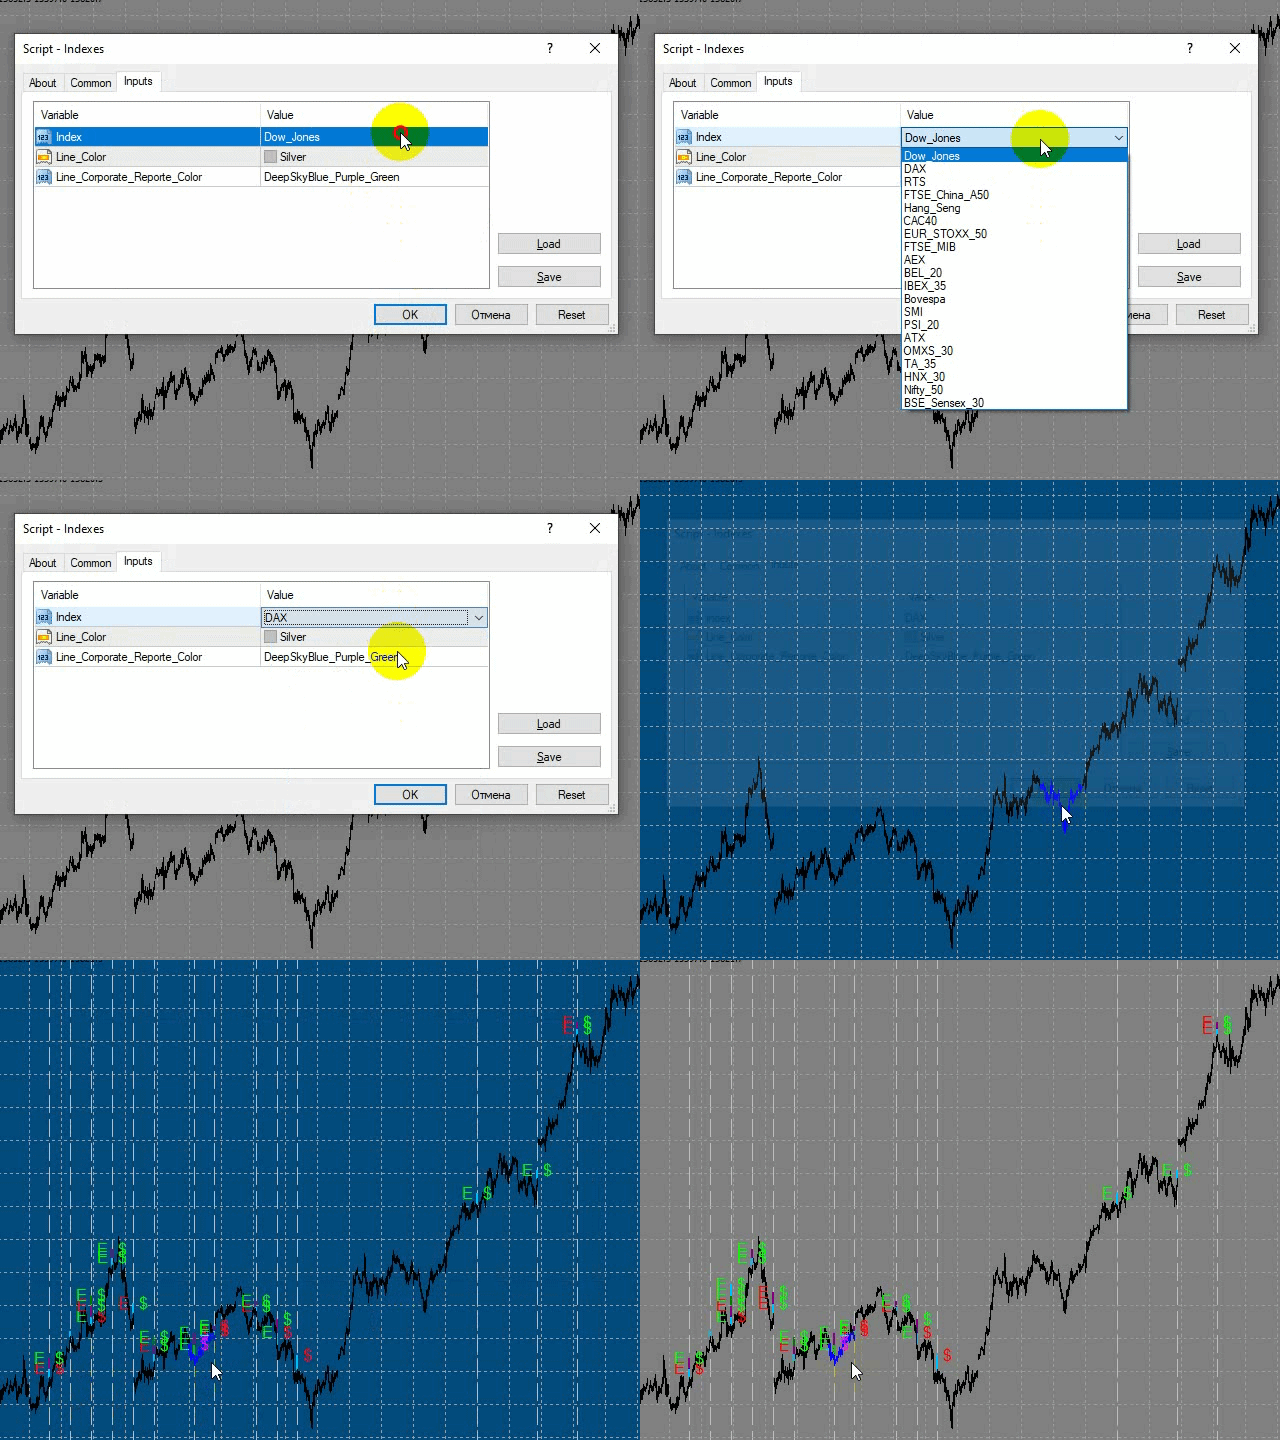
The program (script) displays corporate reports of shares that are part of the index selected in the settings. 

    "Indexes" cannot be tested in the tester (since there is no way to get information from the Internet).


    Information is downloaded from the site investing.com:

    • Report Date
    • Earnings per share (EPS)
    • Income (Revenue)
    • market capitalization


    The principle of operation:

    • Searches for information about corporate reports of shares that are part of the index selected in the settings.
    • While searching for information, the background of the graph changes color to blue.
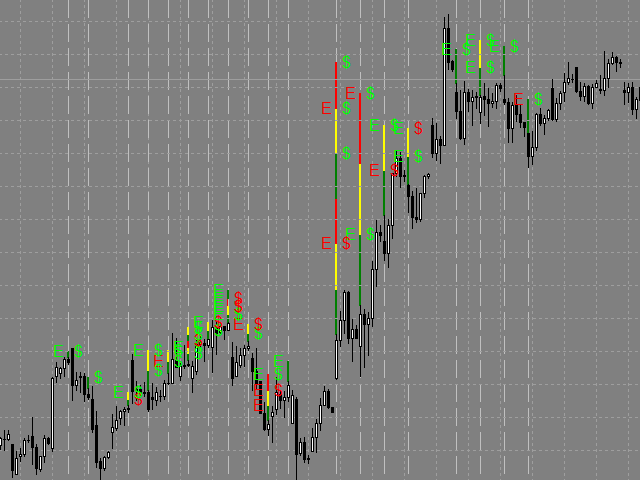
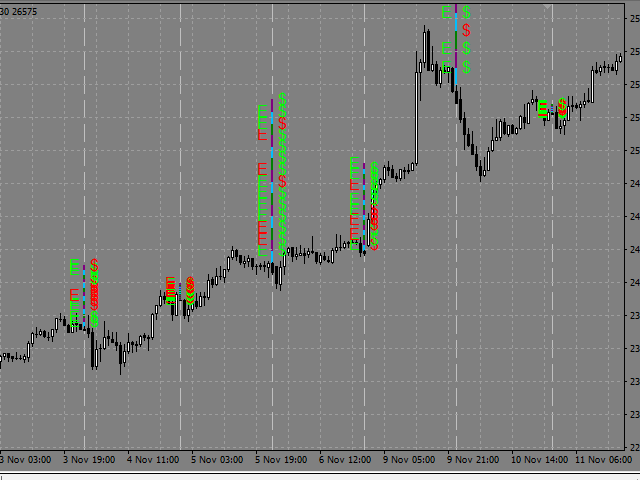
    • Plotting vertical lines corresponding to dates of the published corporate reports. The tooltip of each of the lines contains data on the appropriate corporate report.
        • The E and $ marks are assigned to vertical lines:
        • if EPS value exceeds the forecast, the green E mark is used,
        • if expectations are not met, the red one is used;
        • if Revenue exceeds the forecast, the green $ mark is used,
        • if expectations are not met, the red one is used.
    • There can be several corporate reports in one day (displayed in different colors and higher than the previous one).
      • The program works in Russian and English.
      • In the settings, you can change the color of the lines.


      Before launching :

        The program and all the information used in it depend on the site investing.com and they work as long as it is possible to get information programmatically from the specified links.

        For more convenience, assign a hotkey to the script: right-click "Indexes" in the Navigator window -> Set hotkey -> select a suitable combination.
        Recommended products
        Robot scalper for M5 timeframe. Trades on the GBPUSD currency pair. This robot has been specially developed by a company of professional traders for trading in the pound sterling. The robot approximately opens 5 to 15 trades every day. It is best to trade with brokers that have a low spread on GBPUSD up to 10 pips. The recommended minimum deposit to start is $500 or more. Advantages: does not use martingale. not a net. every trade has a stop loss. professional bot specifically for the GBPUSD p
        If you wish to draw Support and Resistance lines, view: daily market opening, classical pivot levels, Fibonacci pivot levels, trend lines, Fibonacci levels, the remaining time to candle closing, and current spread. If you seek to place your orders with the exact lot that meets your desired stop loss risk. If you wish to do all this and more with just one click, then this is the perfect tool to use. This tool will allow you to feel more relaxed when deciding to open orders, as well as predicting
        Fibonacci Expansion and Retracement Analysis Fibonacci retracing and extended line tools for the MT4 platform, ideal for traders who use the DiNapoli point trading method and the Golden Section trading The main function: 1. You can draw multiple sets of Fibonacci retracements directly, and the relationship between important return points is clear at a glance. 2. Can draw Fibonacci extensions 3. The Fibonacci foldback and extension of the line can be moved left and right for easy observation
        Introduction to X3 Chart Pattern Scanner X3 Cherart Pattern Scanner is the non-repainting and non-lagging indicator detecting X3 chart patterns including Harmonic pattern, Elliott Wave pattern, X3 patterns, and Japanese Candlestick patterns. Historical patterns match with signal patterns. Hence, you can readily develop the solid trading strategy in your chart. More importantly, this superb pattern scanner can detect the optimal pattern of its kind. In addition, you can switch on and off individu
        ZO Trend
        Trung Le Hoang
        4 (4)
        Important!! ZO Trend can't work on MN timeframe. /*--------------------------------------------------------------------------------------------------------------------------------------------------------------------------------------------- ZO Trend an indicator used to search for entry point. With the session candle algorithm on many timeframe, ZO Trend creates an area for traders find good Entry Point. ZO SYSTEM BASIC SETUP :  https://www.youtube.com/watch?v=qdNOXHWozNw ZO TREND User guide : 
        Towers
        Yvan Musatov
        Towers - Trend indicator, shows signals, can be used with optimal risk ratio. It uses reliable algorithms in its calculations. Shows favorable moments for entering the market with arrows, that is, using the indicator is quite simple. It combines several filters to display market entry arrows on the chart. Given this circumstance, a speculator can study the history of the instrument's signals and evaluate its effectiveness. As you can see, trading with such an indicator is easy. I waited for an a
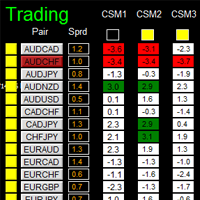
        如果产品有任何问题或者您需要在此产品上添加功能,请联系我 Contact/message me if you encounter any issue using the product or need extra feature to add on the base version. Dashboard Super Currency Strength is an intuitive, and handy graphic tool to help you to: Have 28 pairs under control with one dashboard. Monitor price movement, identify possible trend based on currency strength gap of two currency on 3 timeframe. Provide trading signals based on the CSM (currency Strength Meter) selected. Manage order automatically onc
        Anubis Skunk
        Sayan Vandenhout
        Anubis Skunk USES THE TREND WAVE INDICATOR AND IT CAN IDENTIFY THE BEGINNING AND THE END OF A NEW WAVE TREND MOVEMENT. AS AN OSCILLATOR, THE INDICATOR IDENTIFIES THE OVERBOUGHT AND OVERSOLD ZONES. IT WORKS GREAT TO CATCH THE SHORT TERM PRICE REVERSALS AND USES A MARTINGALE STRATEGY TO CLOSE ALL TRADES IN PROFIT. USE DEFAULT SETTINGS ON H1 OR HIGHER TIME FRAME ON ANY PAIR FOR MORE ACCURATE TRADES WHY THIS EA : Smart entries calculated by 5 great strategies The EA can be run on even a $20000
        Vanglutio
        Sayan Vandenhout
        VANGLUTIO USES THE TREND WAVE INDICATOR AND IT CAN IDENTIFY THE BEGINNING AND THE END OF A NEW WAVE TREND MOVEMENT. AS AN OSCILLATOR, THE INDICATOR IDENTIFIES THE OVERBOUGHT AND OVERSOLD ZONES. IT WORKS GREAT TO CATCH THE SHORT TERM PRICE REVERSALS AND USES A MARTINGALE STRATEGY TO CLOSE ALL TRADES IN PROFIT. USE DEFAULT SETTINGS ON H1 OR HIGHER TIME FRAME ON ANY PAIR FOR MORE ACCURATE TRADES WHY THIS EA : Smart entries calculated by 5 great strategies The EA can be run on even a $20000 ac
        This is the complete REX package. It consists of the lite, pro and ULTRA version.  Perfect for beginners and intermediates. REX complete is 100% non repaint. The strategy is based on a mix of different strategies, statistics, including pivot points, oscillators and patterns.  As the trading idea consists of a variety of some classic indicators like Momentum, Williams Percent Range, CCI, Force Index, WPR, DeMarker, CCI, RSI and Stochastic, it is clear that the fundamental indicators have being u
        Special Candle Do you want to use one of the best Forex indicators with a successful Ichimoku strategy? You can use this Awesome Indicator that is based on the Ichimoku strategy. MT5 version is here First strategy: This strategy involves identifying similar strong crosses that rarely occur. The best timeframes for this strategy are 30 minutes (30M) and 1 hour (H1). Appropriate symbols for the 30-minute timeframe include: •    CAD/JPY •    CHF/JPY •    USD/JPY •    NZD/JPY •    AUD/JPY •    EUR
        Currencies Cleaner panel will give you an overview of all the most traded market's currencies in a single click. First of all the panel will refresh all your charts, opening them four times in all timeframes needed. 1 - CURRENCIES It uses a complex algorithm to study the movement of 17 different indicators. It means that the algorithm not only "reads" the actual value of an indicator, but also creates a probability of success using the position of this value on the indicator and the last moveme
        This is an arrow indicator without a future function,developed based on the most advanced profit trading algorithms.It has the most innovative and advanced dual trend analysis module, as well as the latest and highly effective market trend prediction algorithm.Trends are your friends, and following larger trends can earn the maximum profit in foreign exchange. This indicator helps traders identify current trends and track them. Someone once made a profit of 10 times in a week by relying on it.No
        Details of each condition Type 1. Set no use Hedging Martingale, to open the order by yourself only through the push button. TP and SL follow setting. Set Setting_Hedging =false;     Use_HLine =false;      Set Setting_TrailingStop =false; if not use. Type 2. Semi Auto Recovery Zone You have to open the order by yourself only through the push button. If in the wrong direction and Set true on Hedging Martingale, EA will fix the order with the zone system by use Hedging Martingale Set Se
        The Alpha Trend
        Ellan Dirgantara Tholkhah
        The Alpha Trend Experience the cutting-edge in trend analysis. The Alpha Trend doesn't just identify trends—it filters out the noise, focusing only on the primary movements of price. Whether you're a Binary Option pro or a scalping enthusiast in the Forex world, this tool is tailored for you. Here's the secret: The initial thrust of a major trend often sets its enduring direction, irrespective of the minor fluctuations within. With Alpha Trend, you can decode this momentum, pinpointing the most
        Harvest GOLD
        Sayan Vandenhout
        Harvest GOLD USES THE TREND WAVE INDICATOR AND IT CAN IDENTIFY THE BEGINNING AND THE END OF A NEW WAVE TREND MOVEMENT. AS AN OSCILLATOR, THE INDICATOR IDENTIFIES THE OVERBOUGHT AND OVERSOLD ZONES. IT WORKS GREAT TO CATCH THE SHORT TERM PRICE REVERSALS AND USES A MARTINGALE STRATEGY TO CLOSE ALL TRADES IN PROFIT. USE DEFAULT SETTINGS ON H1 OR HIGHER TIME FRAME ON ANY PAIR FOR MORE ACCURATE TRADES WHY THIS EA : Smart entries calculated by 3 great strategies The EA can be run on even a $30000
        Fx Levels Premium Indicator Support and Resistance are important concepts in trading. Fx Levels Premium was created to easily draw important levels of support and resistance for the active trader. The indicator will give you all important levels (support/resistance) to watch for a wide range of assets. Trading without these levels on your chart is like driving a car for a long journey without a roadmap. You would be confused and blind. Support and resistance levels should be used as guideline
        TRD Prime
        Sergey Smalev
        Торговая стратегия.   Советник представляет собой преднастроенную версию своетника TRD Ultra . Применяет в торговле 4 трендово-сеточные стратегии с различными параметрами. Тем самым обеспечивается распределение рисков по торговым объемам в рынке. Авторская система определения тренда и учет волатильности торгуемой пары позволяют автоматически подстраиваться советнику под настроения рынка. Используется автоматическая фиксация убытка при достижении заданной в настройках просадки. С одержит 5 режим
        Alpha Trend sign has been a very popular trading tool in our company for a long time. It can verify our trading system and clearly indicate trading signals, and the signals will not drift. Main functions: Based on the market display of active areas, indicators can be used to intuitively determine whether the current market trend belongs to a trend market or a volatile market. And enter the market according to the indicator arrows, with green arrows indicating buy and red arrows indicating se
        MT4 Reinvented
        Francis Bouchard
        Welcome guys !  I offer to you this MT4 project I've been working on for the last 2 years ( roughly over 900h of work.. ).  This is a complete tool that will change the way you see MT4, because I almost recoded it entirely ! It will provides you a solid base for risk management, order positionning, hedging, account preservation and journaling. I wanted an all-in-one panel that covers both scalping and swing trading and that suits every type of trader.       Main goal was : NO INPUTS. Never
        Crosskalp1
        Mikhail Bilan
        Добрый День уважаемые трейдеры!  Вашему вниманию индикатор созданный и работающий на базе трендовика ADX,  для торговли на смене направления движения который учитывает коррекцию и даёт возможность на ней заработать.  Применяю этот индикатор для скальпинга. Рекомендую таймфреймы от 15 ти минутного(М15) до часового (Н1) периодов.  Красный кружок сигнал на продажу- Sell) Зелёный кружок  сигнал на покупку Buy) Чем меньше ваш таймфрейм тем меньше пунктов вы зарабатываете.   Важно выставлять стопы! !В
        Gold Phoenix
        Yaroslav Varankin
        The perfect tool for Scalng in the Forex markets You can trade both from signal to signal and using take profit  The algorithm does not use Zigzag!  No redrawing!  This is a channel instrument that uses a moving average as a filter. Moving Average  There are 2 parameters for the settings Ma Period = 5 period Moving Average  Channel 1.0 distance of channel lines from the chart Price Signal Filter - calculation of signal opening and filter There is a complete set of Alert There is a multi-timefram
        Trendiness Index
        Libertas LLC
        5 (3)
        "The trend is your friend" is one of the best known sayings in investing, because capturing large trendy price movements can be extremely profitable. However, trading with the trend is often easier said than done, because many indicators are based on price reversals not trends. These aren't very effective at identifying trendy periods, or predicting whether trends will continue. We developed the Trendiness Index to help address this problem by indicating the strength and direction of price trend
        Trend Analytics is a technical analysis indicator that allows you to determine with sufficient probability when a trend and its direction or flat prevail in the foreign exchange market. The indicator is built on special algorithms. The dignity of which you see in the screenshots. The indicator can work on any timeframe, but to minimize the likelihood of false signals, you should set a timeframe from H15 and higher. In this case, you should use a small stop loss to protect against false signals.
        The Analytical Trend indicator can track sustained price movement in a specific direction. In this case, the movement itself can be downward, upward or sideways, when the market movement does not have a pronounced direction. The indicator works on the basis of two moving averages and an oscillator. Using the signal search algorithm, the indicator generates signals in the form of arrows. Flexible settings allow you to receive more accurate signals for opening positions. You can quickly understan
        Price Action Scanner Pro is an indicator that identifies price behaviors and provides alerts, offering more features and customization compared to Price Action Scanner   (  https://www.mql5.com/zh/market/product/118937?source=Site+Profile+Seller   )   . This indicator can simultaneously detect signals for up to 15 symbols across different timeframes. You can configure it to detect signals during specific trading sessions such as Asian, European, and US sessions, using different timeframes. This
        ECM Elite Channel is a volatility-based indicator, developed with a specific time algorithm, which consists of finding possible corrections in the market. This indicator shows two outer lines, an inner line (retracement line) and an arrow sign, where the channel theory is to help identify overbought and oversold conditions in the market. The market price will generally fall between the boundaries of the channel. If prices touch or move outside the channel, it's a trading opportunity. The ind
        Profile SR
        Teresinha Moraes Correia
        Description of Support and Resistance Indicator Based on Volume Profile for MetaTrader 4 Introduction The financial market is an arena where traders and investors constantly seek ways to gain a competitive edge. One of the most widely used and respected concepts in any market is support and resistance . These levels represent key price zones where supply and demand balance out, and where significant decisions are made by participants who drive the market. Our Support and Resistance Indicator wit
        Arbitrage Indicators is a professional and easy-to-use Forex trading indicator that uses the best trading principles of the latest AI arbitrage models. This indicator provides accurate buy and sell signals. Applies to currency pairs only. It has six different metrics options, MACD, KDJ, RSI, CCI, RVI, DEMARK. It can be freely switched by users, and intuitively shows the direction and reversal signal of the currency pair. When the two lines cross colors, the currency has a high probability of rev
        ZO Trend MTF
        Trung Le Hoang
        1 (1)
        Important!! ZO Trend MTF can't work on MN and W1 timeframe. /*--------------------------------------------------------------------------------------------------------------------------------------------------------------------------------------------- ZO TREND :  https://www.mql5.com/en/market/product/49138 ZO Trend MTF an indicator used to search for entry point. With the session candle algorithm on many timeframe, ZO Trend creates an area for traders find good Entry Point. ZO SYSTEM BASIC SET
        Buyers of this product also purchase
        Unlimited Trade Copier Pro is a tool to copy trade remotely to multiple MT4, MT5 and cTrader accounts at different computers/locations over internet. This is an ideal solution for you if you are a signal provider and want to copy your trades to other receivers globally on your own rules. One provider can copy trades to multiple receivers and one receiver can get trade from multiple providers as well. The provider can even set the subscription expiry for each receiver, so that receiver will not b
        ADAM for FTMO 40
        Vyacheslav Izvarin
        5 (1)
        ADAM EA Special Version for FTMO  Our 1st EA created using ChatGPT technology Trade only GOOD and checked PROP FIRMS  Default parameters for Challenge $100,000 Tested on EURUSD and GBPUSD only  Use 15MIN Time Frame Close all deals and Auto-trading  before Weekend at 12:00 GMT+3  Friday For Prop Firms MUST use special Protector  https://www.mql5.com/en/market/product/94887 ----------------------------------------------------------------------------------------------------------------------------
        ATTENTION   the expert does not work in strategy tester, for a trial version visit my profile. ATTENTION the expert must remain with the operations history in " COMPLETE HISTORY " Manual RiskGuard Management   RiskGuard management was born with the idea of ​​helping traders from their initial journey to becoming expert and aware traders. Compatible with any operating system whether Mac or Windows. The operations panel is integrated into the graph giving the possibility to choose size and positi
        FiboPlusWaves
        Sergey Malysh
        5 (1)
        FiboPlusWave Series products Ready-made trading system based on Elliott waves and Fibonacci retracement levels . It is simple and affordable. Display of the marking of Elliott waves (main or alternative option) on the chart. Construction of horizontal levels, support and resistance lines, a channel. Superposition of Fibonacci levels on waves 1, 3, 5, A Alert system (on-screen, E-Mail, Push notifications).    Features: without delving into the Elliott wave theory, you can immediately open one of
        Mentfx Mmanage
        Anton Jere Calmes
        5 (15)
        The added video will show you the full functionality, effectiveness, and simplicity of this trade manager. Drag and Drop Trade Manager. Draw your entry and have the tool calculate the rest. Advanced targeting and close portions of a trade directly available in tool (manage trades while you sleep). Market order or limit order on either side with factored spread. Just draw the entry, the tool does the rest. Hotkey setup to make it simple. Draw where you want to enter, and the stop loss, the tool c
        Easy Strategy Builder
        Gheis Mohammadi
        5 (3)
        The  Easy Strategy Builder (ESB)  is a " Do It Yourself " solution that allows you to create a wide range of the automated trading strategies without any line of codes. This is the world’s easiest method to automate your strategies that can be used in STP, ECN and FIFO brokers. No drag and drop is needed. Just by set conditions of your trading strategy and change settings on desired values and let it work in your account. ESB has hundreds of modules to define unlimited possibilities of strategi
        News Trader Pro
        Vu Trung Kien
        4.41 (17)
        News Trader Pro is a unique robot that allows you to trade the news by your predefined strategy. It loads every piece of news from several popular Forex websites. You can choose any news and preset the strategy to trade it, and then News Trader Pro will trade that news by selected strategy automatically when the news comes. News release gives opportunity to have pips since the price usually has big move at that time. Now, with this tool, trading news becomes easier, more flexible and more exciti
        Unlimited Binary Options Copier Remote is a powerful tool to copy binary options trades remotely between multiple accounts at different locations over internet. This is an ideal solution for signal provider, who want to share his binary options trades with the others globally on his own rules. One provider can copy trades to unlimited receivers and one receiver can get trade from unlimited providers as well. The provider can set the subscription expiry for each receiver, so that receiver will no
        Pairs Trade
        Oleg Pechenezhskiy
        The Pairs Trade indicator is a utility for semi-automatic pair trading. It allows combining the charts of two arbitrary instruments, even if the schedules of their trading sessions are different. It displays a spread chart in the form of a histogram with an overlaying moving average. It calculates the swap that will be charged for the synthetic position (in the deposit currency). It is possible to set a level for automatic opening of a synthetic position on the spread chart (analogous to the 'se
        This Stacker EA will: Automatically set Stop loss on a new order Automatically set Take profit on a new order Stack (or open up to 4 additional orders at the same time) when a new order is placed, the SL/TP can be preset individually for each order. Provides a transparent replacement for the standard 1-click trading buttons in MetaTrader 4 (1 click still works and SL/TP will automatically be set as well as Stacking). Automatically calculate lot order size according to preset risk management perc
        FXFledgling Exit Tool is a complete risk management tool that analyzes both the open trades and the direction of the pair of open trades. As long as the suggested entry and lotsizing management presented here is followed strictly, you will have a high chance (but no guarantee) of surviving the trade. What It Does It is used as an exit tool. It helps the trader to manage any manual trade that he transacted. It does the following: Trail Stop Dynamic Stop Loss - a calculated stop-loss that changes
        Crypto Market Pro
        Daniil Kurmyshev
        5 (1)
        New opportunities for analyzing cryptocurrency in the usual MetaTrader 4. For example : We select the symbol of the cryptocurrency and attach any indicators, Expert Advisors or scripts. Startup Mode View cryptocurrency; Data collection. Capabilities Work as with a standard currency chart; Automatic update of open charts; Selection of individual cryptocurrency for updating; Selection of individual timeframes for updating; Work on the desired timeframes; Open charts do not affect the work of Cry
        Советник риск-менеджер с огромным арсеналом возможностей защиты вашего депозита. Для инвесторов, которые решили передать капитал в доверительное управление. Когда у трейдера нет доступа к настройкам - нивелирует торговые риски. А также для трейдеров, которые осознали необходимость стороннего контроля за их торговлей для улучшения торговых результатов.  Для максимальных результатов - должен стоять на отдельном VPS сервере и у трейдера не должно быть возможности менять настройки в торговый период.
        Grid Hero War Pad
        Chock Hwee Ng
        3.4 (5)
        Grid Hero War Pad is a  GRAPHICAL MANUAL TRADER version of the original Grid Hero EA, designed and created for ADVANCED TRADERS who are experienced in plotting their own market entries. It is coded using ADVANCED GRAPHICAL INTERFACE programming, that combines the power of discretionary trading with Grid Hero algorithm in the form of a graphical console with button-click easy execution. It allows you to execute trades manually using Market Orders and Pending Orders, and then automatically uses th
        MirrorEA
        Eugenio Bravetti
        The new version of  MirrorSoftware 2021  has been completely rewriten and optimized.  This version requires to be loaded only on a single chart because  it can detect all actions on every symbol and not only the actions of symbol where it is loaded. Even the  graphics and the configuration mode  have been completely redesigned. The MirrorSoftware is composed of two components (all components are required to work):  MirrorController  (free indicator): This component must be loaded into the MASTER
        Open charts
        Maksim Slovakov
        Скрипт открывает графики по всем инструментам находящимся в окне "Обзор рынка" и по желанию может задать для всех графиков один шаблон. Так-же можно удалить все графике открытые в терминале Мт4. В скрипте имеются следующие настройки: "Таймфрейм" по умолчанию M30;             (Можно поставить свой: M1, M5, M15, M30, H1, H4, D1, W1, MN.) "Задержка" по умолчанию "0";                  (Задержка перед открытием следующего графика в миллисекундах.) "Шаблон" по умолчанию "True";                (True=пр
        Quantized Trend
        Oleg Pechenezhskiy
        This utility automatically draws the trend channel on the price chart. For the time interval from the specified date to the current bar, the drawn channel is almost optimal. Placing the beginning of the channel at a more distant historical price extremum, you get a visualization of a longer-term trend. Channel slope is not a continuous value, but takes one of discrete values (in AxB format, where A is the number of price points (points), and B is the number of timeframes). This program works ONL
        Forex copier
        Alexandr Bryzgalov
        We offer simple and reliable software that can  copy trades  between any MT4 accounts. Easy to use MetaTrader copier which saves valuable time Reliable, so you are protected from technical issues Powerful, with a lot of features available Who can use this MT4 copier? Forex Copier is a solution for individual traders or account managers who need to execute trade signals from external sources or who need to  manage several MetaTrader 4 accounts  at the same time. We do not offer you “yet another
        Forex Market View Dashboard and CSM
        Opengates Success International
        5 (1)
        FFXMV Dashboard + CSM is a custom indicator combined with Currency Strength Meter . It is created to give the Traders a full view of what is going on in the market. It uses a real time data to access the market and display every bit of information needed to make a successful trading. Before attaching this Indicator to your window chart, go to your MT4's Market Watch panel and HIDE all the Currency pairs you don't need or trade and leave the rest there. The reason is that FFMV Dashboard will DISP
        Trendline Scalper Robot
        Vijay Vikram Singh Kushwah
        Trading  Robot which automates your scalping and take your profitability  and forex trading experience to the next level ,Computer cannot analyse market as humans do, at same time we cannot compete with them in terms of speed of execution, hft  & emotionlessness  .  ​In this scalp-trading robot we have integrated human analysis with quick algorithmic execution  to enter and exit trades at fraction of seconds Get More details at :  https://www.noemotionfx.com/tl-scalper-ea To test , use it in dem
        Exploit currency inefficiencies for risk-free trading A triangular arbitrage strategy exploits inefficiencies between three related currency pairs, placing offsetting transactions which cancel each other for a net profit when the inefficiency is resolved. A deal involves three trades, exchanging the initial currency for a second, the second currency for a third, and the third currency for the initial. With the third trade, the arbitrageur locks in a zero-risk profit from the discrepancy that exi
        NewsReady
        Joel Protusada
        NewsReady is a semi-automated Expert Advisor that uses a smart straddle methods It needs to be set in charts 2 to 10 minutes before Economic Data release with a red-flag impact on currencies related to the news. Then it run pending orders in specified number of minutes indicated in the time-period parameter. After the specified time, it will stop trading and will remove all pending orders. Important You can not backtest this tool because it is semi-automated and can only be set and run a few min
        Automatic enumeration of input parameters of the TrendImprovement Pro indicator to find the optimal combination. Description. A powerful tool for testing the input parameters for the TrendImprovement Pro indicator will allow you to quickly find the most profitable options for the input parameters. Settings DateOrBars – switch for using time or number of bars;  MaxBars - the maximum number of bars for calculation; StartHistory - indicator start time; BEGINNING - the initial historical data (In-S
        Advanced Smart Renko and Heiken Ashi Candle Trader is ONE STOP SOLUTION based semi/fully - automated multi-currency EA carefully engineered for traders to enter the trade based on their Analysis or in fully automated mode for scalping, trend trading, candle breakout trades and also automated news trading with inbuilt trade management solution.    Advantages    No grid / Martingale Works on Classic Renko, Renko Heiken Ashi charts and classic Heiken Ashi charts    Features Multi-Currency Ma
        Binary expert
        Dmitriy Konogorov
        Expert for a binary options on mt4, he have  two built-in a indicators and many different settings. The expert has one a level of martingale, but it is recommended to use it on  the instruments with a yield of 85 percent. it can be used simultaneously on a variety of currency instruments. All settings have already been made, but you can also configure them yourself . Currency for do trading is a Russian ruble. Good trading to everyone.
        This program is created by algorithm which economy based logic in the trading market. 1. The program able to work with all of currency and trading items  2. Take profit and loss are basically handled by EA program Recommendation: EUR_USD is the most preferred. Please use this program only for MT4. LOT should be managed depends on own deposit. Otherwise, high risk will be driven(e.g 0.1~0.2 lot is recommended when the deposit is 10,000 dollar)
        In foreign exchange trading, the most important investment principle is to ensure the safety of the principal, and risk prevention and control is the primary operation concept. How to manage the account funds is to control the position size and the profit and loss of the order, this EA is designed based on this idea. It can directly manage the risk control of the trading account and realize two functions. One is to close the position according to the profit and loss ratio, and the other is to au
        1. Record the price data for each Tick transaction. Data file contents: "Tick time", "ASK price", "BID price", "SPREAD SPREAD", "Tick quoted quantity". 2. Meanwhile, generate a quotation data file with a 1-minute period. Content of 1min data file: "ASK time", "ASK OPEN price", "ASK HIGH price", "ASK LOW price", "ASK CLOSE price", "BID time", "BID OPEN price", "BID HIGH price", "BID LOW price", "BID CLOSE price", "Tick quoted quantity". 3. Save all quotation data in one file every day, which is c
        Trade Control
        Andrii Malakhov
        Утилита-риск-менеджер для защиты вашего депозита от полной потери денег. Если вы инвестор и решили передать деньги в доверительное управление, вам нужен Trade Control. Так трейдер не нарушит свои же правила риск-менеджмента и не сольет все ваши деньги. Для этого Trade Control должен находится на вашем VPS. И у управляющего трейдера не должно быть доступа к настройкам данной улититы. В момент слабости, трейдер не сможет увеличить заложенные в торговлю риски. И не потеряет ваш депозит за один неуд
        Flash Trade
        Bai Jiang Zhou
        5 (1)
        # If you have any other requirements or are interested in collaboration, please contact dev.quantech.london@gmail.com . Flash Trade (FT) Most friendly manual trading tool. Easy operation to secure your funds. Features of FT Click the chart to trade fast FT supports market orders and pending orders Click twice to complete the order and set SL and TP Click trice to complete the pending order and set SL and TP Automatically set the stop-loss amount of each order to a fixed percentage of the balan
        More from author
        The indicator builds a graphical analysis based on the Fibonacci theory. Fibo Fan is used for the analysis of the impulses and corrections of the movement. Reversal lines (2 lines at the base of the Fibonacci fan) are used to analyze the direction of movements. The indicator displays the of 4 the target line in each direction. The indicator takes into account market volatility. If the price is above the reversal lines, it makes sense to consider buying, if lower, then selling. You can open posi
        The indicator draws support and resistance lines on an important part of the chart for making decisions. After the trend line appears, you can trade for a breakout or rebound from it, as well as place orders near it. Outdated trend lines are deleted automatically. Thus, we always deal with the most up-to-date lines. The indicator is not redrawn . Settings: Size_History  - the size of the calculated history. Num_Candles_extremum  - the number of candles on each side of the extremum. Type_Arrow
        Ichimoku Map (instant look at the markets) - built on the basis of the legendary Ichimoku Kinko Hyo indicator. The task of the Ichimoku Map is to provide information about the market strength on the selected time periods and instruments, from the point of view of the Ichimoku indicator. The indicator displays 7 degrees of buy signal strength and 7 degrees of sell signal strength. The stronger the trend, the brighter the signal rectangle in the table. The table can be dragged with the mouse. The
        Scalper Assistant MT5
        Pavel Verveyko
        5 (2)
        The indicator is a trading system for short-term trading. Scalper Assistant helps to determine the direction of the transaction, and also shows the entry and exit points. The indicator draws two lines (possible points for opening positions). At the moment of the breakdown of the upper line up (and when all trading conditions are met), an up arrow appears (a buy signal), as well as 2 goals. At the moment of the breakdown of the lower line down (and when all trading conditions are met), a down ar
        Turn
        Pavel Verveyko
        The indicator shows the market turning points (entry points). Reversals allow you to track rebound/breakout/testing from the reverse side of the lines of graphical analysis or indicators. Reversals can be an independent signal. The indicator allows you to determine reversals taking into account the trend and without it. You can choose a different period for the movement preceding the reversal, as well as the volatility coefficient. When plotting reversals, the indicator takes into account volati
        Length Movement
        Pavel Verveyko
        5 (1)
        Measures the length of the selected movement in points, shows the duration of the movement, as well as the speed of movement.   Outputs the average value of each dimension. It is designed to calculate the expected target based on typical market movements. The intended goal will provide information about the ratio of the stop size to the possible profit and will allow you not to open positions with a small expected profit. It will also help you determine the point at which it is more logical to c
        The indicator allows you to quickly switch from one instrument to another, from one time period to another using the keyboard or buttons on the monitor. Each command can be assigned a hot key from 0-9, a-Z (case-insensitive) and VK_OEM_COMMA ("<" on the keyboard) and VK_OEM_PERIOD (">" on the keyboard). This can help you to operate the maximum number of instruments that are available at your broker, analyze more instruments/periods in less time. This product cannot be tested in the tester , beca
        Ratio TP SL
        Pavel Verveyko
        5 (1)
        This indicator allows you to measure the profitability of each specific transaction (the ratio of Stop and Profit). The indicator allows you to adjust the ratio by step size and number of steps. You can build an unlimited number of ratios to compare the risks from different movements. Note: in MT4, the number of horizontal lines in a single ratio cannot exceed 32. Building a line : click the " Ratio " button and draw a line (mouse click - the first point of the line, where the mouse is release
        Corporate Report
        Pavel Verveyko
        5 (1)
        The script displays info about the share's corporate reports and dividends. The data is downloaded from   investing.com : Report date Profit per share (EPS) Revenue Market capitalization Amount of dividends Date of payment of dividends Dividend income The product cannot be tested in the tester (since it is not possible to receive data from the Internet). Before launching:  Add 2   URL   https://ru.investing.com/earnings-calendar/Service/getCalendarFilteredData  and   https://ru.investing.com/di
        Channel FTF
        Pavel Verveyko
        The Envelopes indicator determines the presence of a trend or flat. It has 3 types of signals, shows the probable retracement levels and levels of the possible targets. The Fibonacci coefficients are used in the indicator's calculations. Signals (generated when touching the lines or rebounding from lines): Trend - the middle line of the Envelopes has a distinct inclination; the lines below the channel's middle line are used for buy trades, the lines above the middle line and the middle line itse
        Mr Big
        Pavel Verveyko
        The indicator shows and highlights the chart candles, which are formed as a result of large players entering the market in large volumes. Such candles can also be formed after achieving a certainty on the market, when most of the participants hold positions in the same direction. The movement is likely to continue in that direction after such candles. The indicator highlights the significant candles from the existing ones on the chart; The indicator allows identifying the trends based on candles
        Splash
        Pavel Verveyko
        The indicator identifies the most suitable moment for entering the market in terms of market volatility, when the market has the strength to move (the signal is indicated by an arrow under the candle). For each of the signals, the presence of trends on the current and higher timeframes is determined, so that the signal is in the direction of the majority of positions opened on the market (denoted near the signal by abbreviations of timeframes with a trend present). The signal appears after the c
        The indicator displays the key support and resistance levels on the chart. The significance of these levels lies in that the price may reverse or strengthen the movement when passing such levels, since they are formed as a consequence of the natural reaction of market participants to the price movement, depending on which positions they occupied or did not have time to occupy. The psychology of the level occurrence: there always those who bought, sold, hesitated to enter or exited early. If the
        This indicator is a multitimeframe trading strategy. It has the levels for stop loss, take profit and entry point. The order level can also be set manually. The indicator uses the regularity of the market, which manifests itself on all instruments, and does not require adjustment of the parameters. The strategy uses a proprietary approach to determining: trend, volatility, hierarchy of timeframe significance, the size of the history period (the number of candles), which is important for making a
        Trend Sync
        Pavel Verveyko
        5 (1)
        The indicator shows the trend of 3 timeframes: higher timeframe; medium timeframe; smaller (current) timeframe, where the indicator is running. The indicator should be launched on a chart with a timeframe smaller than the higher and medium ones. The idea is to use the trend strength when opening positions. Combination of 3 timeframes (smaller, medium, higher) allows the trend to be followed at all levels of the instrument. The higher timeframes are used for calculations. Therefore, sudden change
        The indicator detects important peaks and troughs (extremes) on the chart. These points can be used to plot support/resistance levels and trend lines, as well as any other graphical analysis. These points can serve as reference points for setting trading orders. The indicator does not redraw . Settings: Size_History  - the size of the calculated history. Num_Candles_Right  - number of candles to the right of the peak or trough. Num_Candles_Left  - number of candles to the left of the peak or
        Running along Lines
        Pavel Verveyko
        3 (2)
        The indicator draws support and resistance lines on an important part of the chart for making decisions. After the trend line appears, you can trade for a breakout or rebound from it, as well as place orders near it. Outdated trend lines are deleted automatically. Thus, we always deal with the most up-to-date lines. The indicator is not redrawn . Settings: Size_History  - the size of the calculated history. Num_Candles_extremum  - the number of candles on each side of the extremum. Type_Arrow
        Key Volumes
        Pavel Verveyko
        1 (1)
        The indicator shows key volumes confirmed by the price movement. The indicator allows you to analyze volumes in the direction, frequency of occurrence, and their value. There are 2 modes of operation: taking into account the trend and not taking into account the trend (if the parameter Period_Trend = 0, then the trend is not taken into account; if the parameter Period_Trend is greater than zero, then the trend is taken into account in volumes). The indicator does not redraw . Settings History_S
        This trading system is based on market impulses of varying complexity.   To generate a signal, the indicator uses the moments when the direction of the pulse and the necessary section of the trend coincide. The indicator also takes into account the current market volatility. Stop_loss tags can be set with the parameter "0" or "1", then Stop_Loss will take into account market volatility.   Take_Profit tags can be set with the parameter "0", then Take_Profit will take into account market volatil
        Fibo World
        Pavel Verveyko
        The indicator builds a graphical analysis based on the Fibonacci theory. Fibo Fan is used for the analysis of the impulses and corrections of the movement. Reversal lines (2 lines at the base of the Fibonacci fan) are used to analyze the direction of movements. The indicator displays the of 4 the target line in each direction. The indicator takes into account market volatility. If the price is above the reversal lines, it makes sense to consider buying, if lower, then selling. You can open posi
        The indicator determines the state of the market: trend or flat. The state of the market is determined by taking into account volatility. The flat (trading corridor)is displayed in yellow. The green color shows the upward trend. The red color shows the downward trend. The height of the label corresponds to the volatility in the market. The indicator does not redraw . Settings History_Size   - the amount of history for calculation. Period_Candles  - the number of candles to calculate the indicat
        The indicator plots flexible support and resistance levels (dots). A special phase of movement is used for construction. Levels are formed dynamically, that is, each new candle can continue the level or complete it. The level can provide resistance or support to the price even where it is no longer there. Also, support and resistance levels can change roles. The importance of levels is affected by: the amount of time the level is formed and the number of touches. The significance of these lev
        The indicator is a trading system for short-term trading. Scalper Assistant helps to determine the direction of the transaction, and also shows the entry and exit points. The indicator draws two lines (possible points for opening positions). At the moment of the breakdown of the upper line up (and when all trading conditions are met), an up arrow appears (a buy signal), as well as 2 goals. At the moment of the breakdown of the lower line down (and when all trading conditions are met), a down ar
        Gold n XAU
        Pavel Verveyko
        The trading system is designed to work with gold on time periods: 30M, 1H. The indicator allows you to adjust to the market situation. Parameters for 1H :   PERIOD=9F ,   FILTER=300 .   Parameters for  30M :   PERIOD=22B ,   FILTER=450 .   A small adjustment to a specific broker is allowed .   If you change the amount of history displayed, you may also need to adjust the parameters. The indicator is not redrawn.     "Gold n XAU" uses different rules for entering a trade and different rules fo
        The indicator builds "psychological levels": levels of round numbers and intermediate levels of round numbers. Round numbers play an important role in forming support and resistance levels. There is a pattern in which the decline or growth of the price can stop at round numbers. The level whose price ends at 0 is the level of a round number of the first order. Intermediate level, this is the level between two round levels, for example, between 10 and 20 this is level 15. In the " Num_Zeros "
        Ichimoku Map
        Pavel Verveyko
        Ichimoku Map (instant look at the markets) - built on the basis of the legendary Ichimoku Kinko Hyo indicator. The task of the Ichimoku Map is to provide information about the market strength on the selected time periods and instruments, from the point of view of the Ichimoku indicator. The indicator displays 7 degrees of buy signal strength and 7 degrees of sell signal strength. The stronger the trend, the brighter the signal rectangle in the table. The table can be dragged with the mouse. The
        The indicator displays a stock chart of a non-standard type, in which the price and time have the same value. The usual chart of Japanese candlesticks does not take into account all the information that the time analysis can give. Renko charts do not use all the information that price can give in relation to time. The "Chart Price and Time" indicator takes into account price and time equally and shows the predominance of price or time. Taking into account price and time equally gives an idea
        The indicator tracks sharp volatility (moments when the market has shown increased activity and movement may occur), on the selected instruments and time periods. The information is displayed as colored rectangles. Thus, it is possible to assess at a glance which tool should be given priority attention. The indicator will be useful for scalpers when they need a quick reaction or for traders working with a large number of instruments. The indicator does not redraw. The indicator displays 8 degree
        The Alert Creator indicator is designed to create alerts for selected conditions. You can select one or several indicators for the notification. If several conditions are selected, the alert is triggered when all the selected conditions are met. The signals can be configured separately for buying and separately for selling. Example, a buy alert: the closing price is above the moving average, the RSI is below 20. (In this example, 2 indicators are used to generate an alert: MA and RSI) At the
        The indicator determines the strength of the trend and its possible reversal points, based on the author's arithmetic approach . Each new peak or trough is a trend development. Such peaks and troughs are numbered so that the strength of the trend development can be seen. Attempts to change the trend are also numbered. This gives an understanding of a possible change in the direction of the trend. Indicator signals are generated when trying to change the trend . In the settings, it is possible
        Filter:
        mambobody
        462
        mambobody 2022.07.28 11:03 
         

        User didn't leave any comment to the rating

        Reply to review
        Version 1.1 2021.06.22
        correction of the information search algorithm