True equity curve
- Indicators
- Kaijun Wang
- Version: 1.0
- Activations: 5
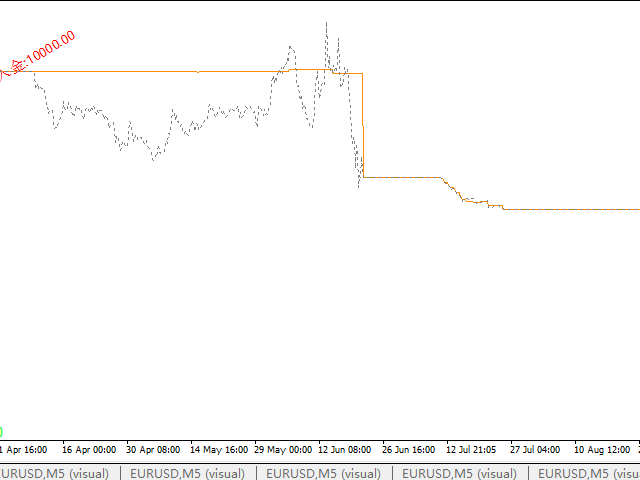
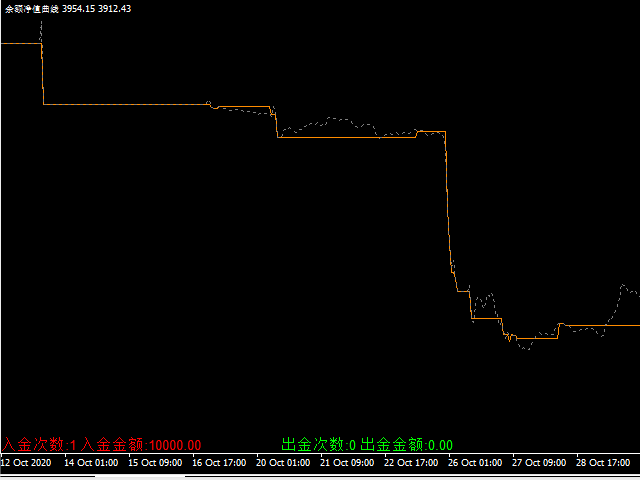
After the indicator is loaded, it will display a close to the real balance net value change graph, and contain deposit and withdrawal prompts, etc.
1. The indicator is the trend display of net balance
2. The net value estimation uses the reverse order calculation, and the trend of each currency pair order on the K-line chart is retrospectively estimated to obtain a more accurate net value
3. If you want all the history to be calculated, please select all in the history, if you don't need all, you have the right to choose.
4. There will be incorrect tickvalue values on the platform, causing inaccurate calculations in a certain area, and most of them will automatically handle exceptions
5.Grasp the true net worth curve, you can screen many Martin and grid EAs to a certain extent, prevent such EAs from artificially making curves, and only show the trend of their balance trends.
6. The deposit and withdrawal will be displayed in the corresponding position
7. Switching cycle, changing with the time axis
I hope you all have a happy transaction, your net worth, and your balance will go up and up. You are bullish!
