Levels Trader
- Experts
- Heiko Kendziorra
- Version: 1.2
- Updated: 22 November 2020
- Activations: 8
The unique Levels EA trades dozens of profitable strategies in any chart. All strategies are easy to understand, can be edited and changed to trade other strategies, currencies, CFDs or timeframes. A handful of strategies can be downloaded in the Comments section and with some time and patience everybody can program own trading strategies without programming knowledge. With a little analytical mind it should be easy.
No martingale, no grid, always just one order open with StopLoss. Levels Trader works in any chart.
Parameters like moving averages or volatility can be considered in the setup. Its current value is shown in a comment in the chart, values from the past and more info is shown in 'Experts'. Levels Trader enables active traders to trade own ideas, future versions will make more setups possible in an easier way.
Timing is important! Set SetUTC (GMT) according to the timezone of your broker! More info in Comments.
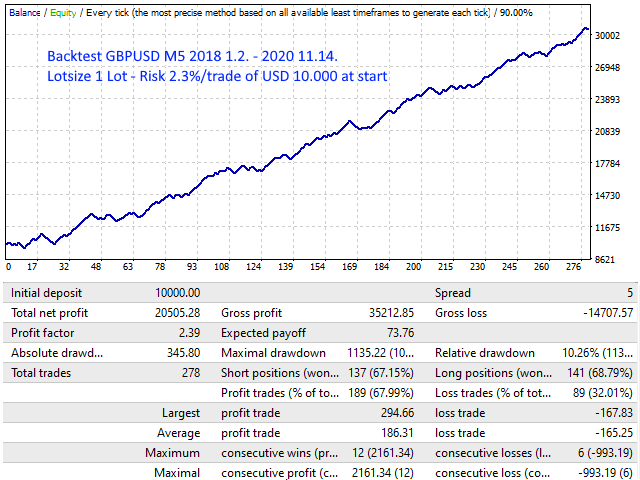
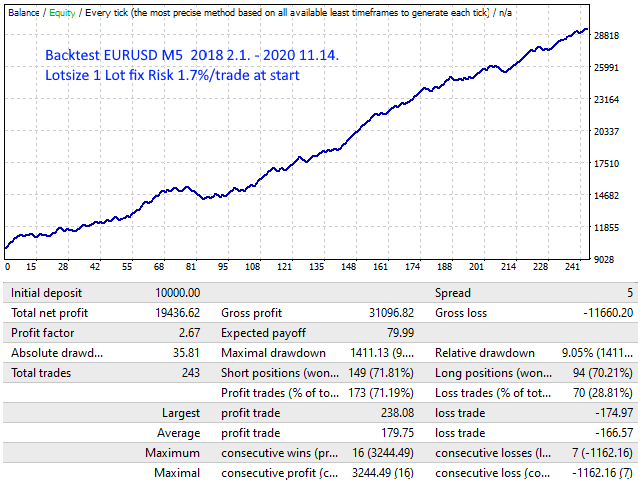
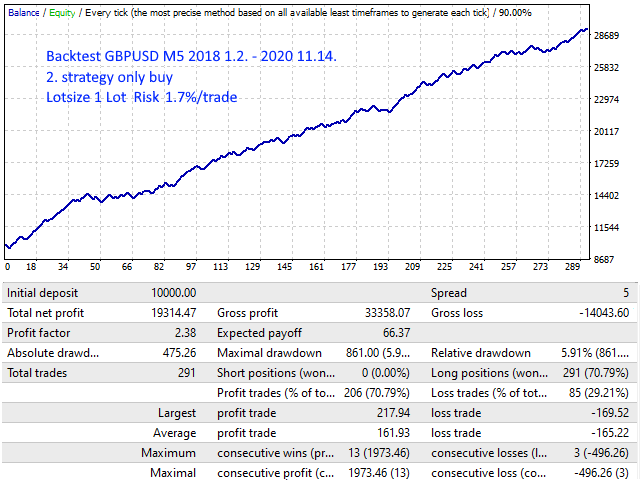
For a correct backtest download M1, M5, H1, D1 and W1 data for the test period and use set files as provided in the comments!
Settings
(As space here is limited see info in the screenshots below and in the Comments section)-
SetUTC - timezone. Default set UTC=2 is best, used by many brokers
-
Auto_Moneymanage: automatic money management On or Off
-
MiniLots: if true, Auto_Moneym. has steps of 0.01 lot
-
MaximumRisk: % of account free margin set on risk for a trade
-
Lots: lot size if Auto_Moneym. is disabled
-
OrderQuantity: 1=Single 2=Hedging 3=Multi
-
-
BuyTrigger: a acronym describes what triggers a trade. If set 'any' a trade is triggered if all following settings are met.
If set 'hhd1cup' it means: highest high of day 1 (the day before) crossed up
- If a candle opens below the high of the former day and closes above it (it crosses hhd1) a buy is triggered.
If set hhd1cup in SellTrigger it opens a sell. In the Comments is list of acronyms to trigger (or suppress) trades.
Any high or low of former days or weeks or month can be used. The levels are drawn as horizontal lines in the chart if the last setting DrawLines=true.
To understand the following easier read the description of the indicator: Support Resistance Free
If a main trigger condition is met, the settings below filter it. If only the main trigger condition is met for buy a sky-blue arrow marks it in the chart.
If the conditions of the filters below are also met the arrow is blue. For sell trades the arrow is orange-red or red if all conditions are met.
How to adapt given strategies for other pairs or develop own strategies see in the Comments.
-
AddBuyCond: describes further conditions that must be met to trigger a trade.
-
Up to 9 conditions can be set in a line, a number at the start of the line states if just one or all conditions must be met. (and or or connection)
-
ExcluBCond1: Ex..2 etc describe further conditions that must be met to block trades (again a number states: and or or)
-
StopLossBuy: distance of stop loss
-
TakeProfitB: points profit when a buy order is closed
-
SLtoEntryPointsB: points profit when the stop loss is set to order open price
-
EntryOffsetB: distance where the stop loss is set above order open price
-
StartTrailBuy: distance where the trailing stop starts acting
-
TrailDistanceBuy: distance where the trailing stop sets SL
-
HourStartStopBuy: EA start and stop hours
-
HoursNoTrB: hours when no buys are triggered. up to 6 hours can be set
-
MoHrStartStopB, TuHrStartStopB etc set start and stop hours for each weekday
-
FilterB1dma ..B2 ..B3 set min + max values for 2 moving averages at 3 periods of time, this + below see Comments
-
MinutesNoTradeB1 ..B2 ..B3 set the minutes when EA not trades
-
VolaB1minB1 ..B2 ..B3 set the minimal volatility
-
-
Then follow same setting for Sell orders
-
HrFriStop: hour EA stops opening orders Fridays (24 = disabled)
-
HrFriClose: hour when the EA closes open orders Fridays (24 = disabled)
-
magic: magic number
-
DrawLines: draws Highs and Lows of former days, weeks and month in the chart. Mouseover shows the name of the line
