Multicurrency Trend Detector
- Indicators
- Aleksey Ivanov
- Version: 1.0
- Activations: 5
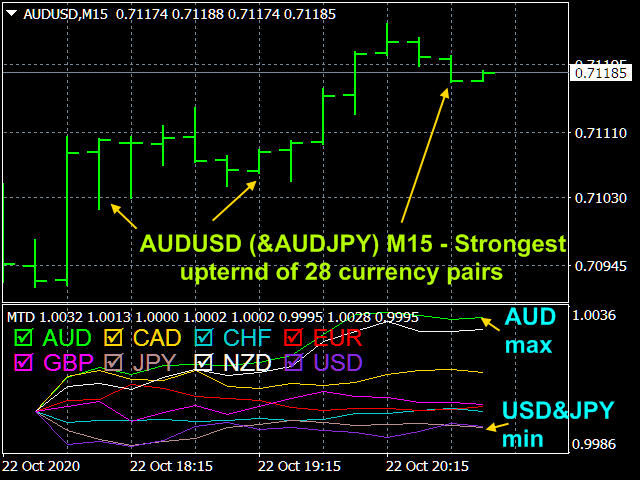
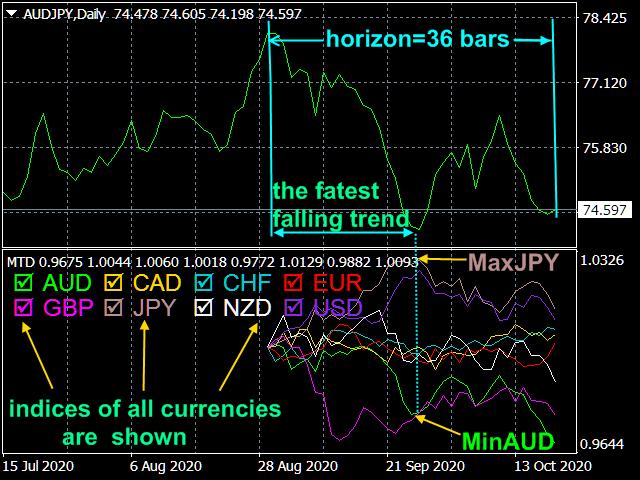
The Multicurrency Trend Detector( MTD) indicator allows you to immediately and on one chart on a selected time interval (extending from a zero bar to a bar set in the settings by the value horizon) determine the presence, direction and strength of trends in all major currencies, as well as assess the reliability of these trends.
This is achieved by calculating indices (non-relative purchasing power) of eight major currencies, namely: AUD, CAD, CHF, EUR, GBP, JPY, NZD and USD, of which 28 currency pairs are composed, the states of which are easily estimated by such indices. At the same time, the Index (X) indices of these currencies X are reduced to one at the horizon point, i.e. the graph displays the values of the reduced index Index (X, t)/Index (X, horizon), which allows one graph to easily correlate with each other the evolution of indices of all currencies that originate there from a single point on the horizon.
If, for example, such an index of currency X on this chart rises the most, and the index of currency Y, on the contrary, falls the most, then the currency pair X/Y will grow the fastest in a given time interval. Moreover, the trends of currency pairs in which the index of one of the currencies falls, and the index of another currency is growing, are the most stable.
The indices of these major currencies are calculated based on the USDX dollar index, which is determined by the standards adopted by the Intercontinental Exchange( ICE), where this index is calculated as a geometric weighted average of these currencies using the formula:
USDX= 50.14348112 * USDEUR^(0.576) * USDJPY^(0.136) * USDGBP^(0.119) * USDCAD^(0.091) * USDSEK^(0.042) * USDCHF^(0.036),
showing the value of the US dollar against a basket of six major currencies: the euro (EUR), the yen (JPY), the pound sterling (GBP), the Canadian dollar (CAD), the Swedish krona (SEK), and the Swiss franc (CHF).
For the indicator to work, you need to load the history (Tools / History Center) of quotes EURUSD, USDJPY, GBPUSD, USDCAD, USDSEK and USDCHF.
The information display chart for each currency has its own "check-box", which, for the convenience of analysis, can both hide the corresponding currency and display it.
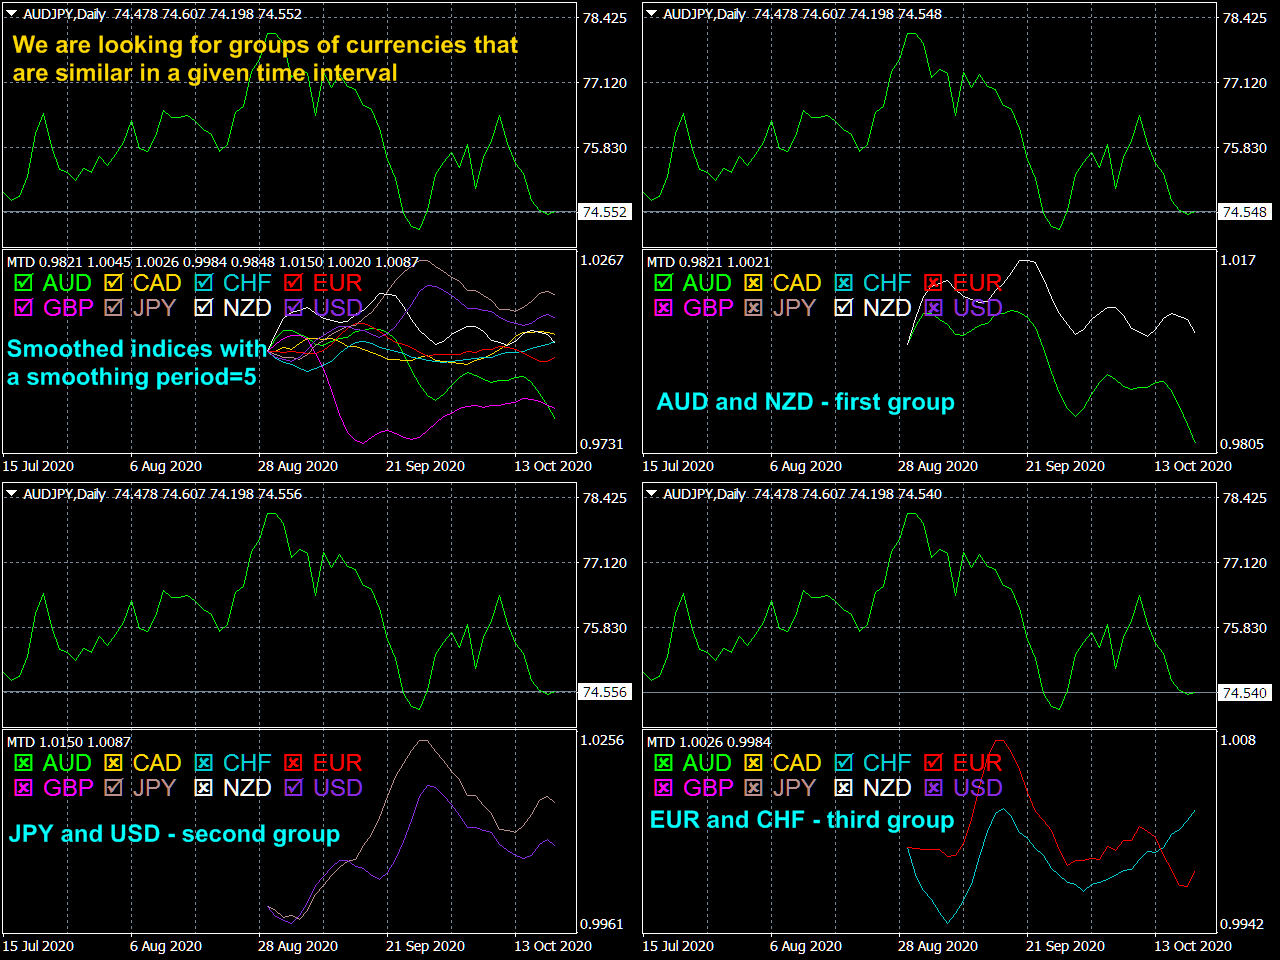
In addition, the indices can be averaged with a moving average.
Using the indicator in trading.
Since the indexes of currencies reflect the true economic conditions of the respective states, the growth of the index indicates the growth of the economy, and the fall - of the fall, which expresses true or reliable trends. Therefore, if the Index (X) of currency X in a currency pair X/Y rises, and Index (Y) of currency Y falls, then this is the most reliable signal to buy X/Y. The indicator allows you to immediately visually identify the fastest growing currency and the fastest falling currency, which allows you to instantly see (at a given time interval) the pair with the strongest trend out of many (28 pieces) currency pairs. The trends of currency pairs arising from the joint growth of their constituent currencies or their joint fall are extremely unstable and subject to large and unpredictable random fluctuations.
In addition, the indicator on a given time interval easily identifies similarly changing currencies X, Z, etc., which allows you to compose such portfolios of currency pairs X/Y, Z/X, etc. in which separate multidirectional price fluctuations will compensate each other, reducing drawdowns.
Indicator settings.
- The calculation horizon of the reduced index (in bars). Values: any integer (14 default).
- Average indexes? Values: true, false(default), .
- The averaging period - Values: any integer (5 default).
- Color AUD
- Color CAD
- Color CHF
- Color EUR
- Color GBP
- Color JPY
- Color NZD
- Color USD


