Chart Projection
- Indicators
- Lorentzos Roussos
- Version: 2.4
- Updated: 24 July 2021
Chart Projection Indicator
Chart projection started as a small indicator that used the built in zig zag technical indicator to forecast future price action (you can find the old algorithm in the comments)
The idea is simple , past price action does not translate into the future but maybe if we don't get overly specific ,or , overly generic ,we can extract guidelines about what could happen.
The "thesis" of Chart projection is this :
Traders will look at the chart to make their decisions , so , the algorithm could look at the chart as well . Not read indicator values , not read prices but look at the chart
To look for something is to find a repeating familiar pattern , and , in order to find that familiar pattern you need to store it.
Zig zag was not enough for that and a new algorithm that does that and also retains data about the visual aspects of the chart was needed , hence the Optics algorithm.
Chart Projection is equipped with 3 optics algorithms for Low , Mid and High range scanning of a pairs price action. Each optic gathers historical data immediately relevant to a charts Points of Interest .
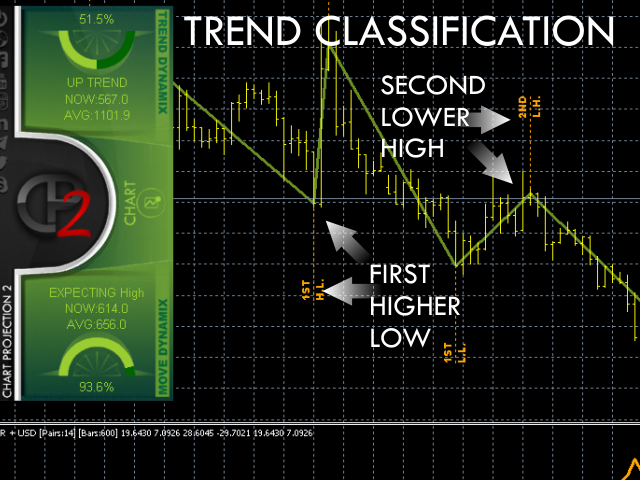
A point of interest is a high or a low ,but that is not where our analysis should stop . Each high and low has a lead in momentum and a result , as well as its position in the overall trend . The optics algorithm gathers that along with the time leading up and leading away to the point of interest. Data from each optic is gathered continuously as price develops and produces estimates for how price behaves when specific POIs (points of interest) emerge. When a POI is detected, a matching process initiates which tries to find the most similar set of optimized data that fits the price behavior around that POI.
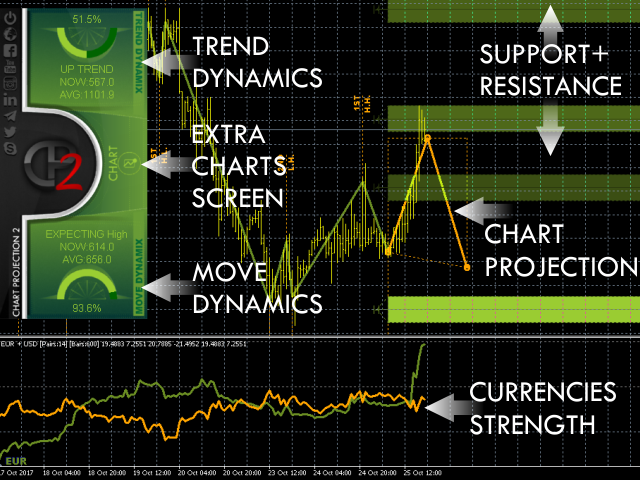
The latest update brings additional features to it such as:
- Seven additional projection methods .
- Display of support and resistance zones.
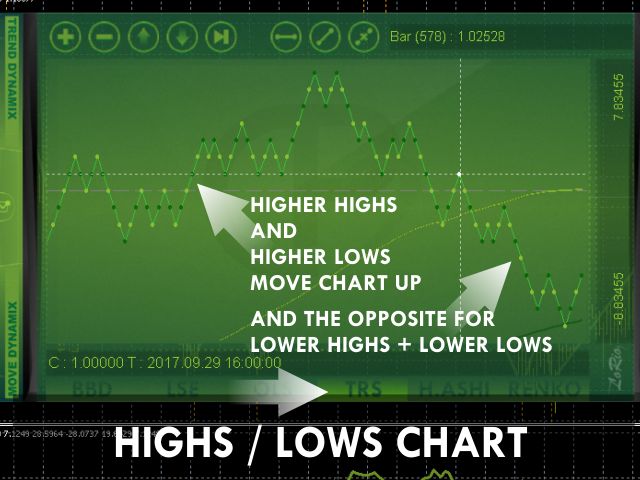
- Display of Highs/Lows and their place within the overall trend.
- Optional Currency Strength index, with separate display window.
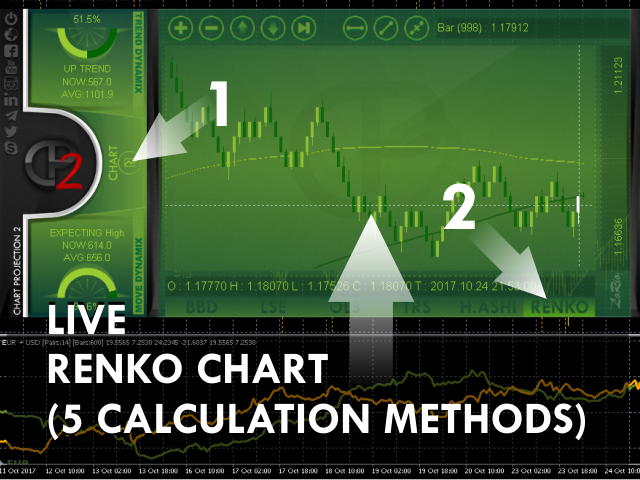
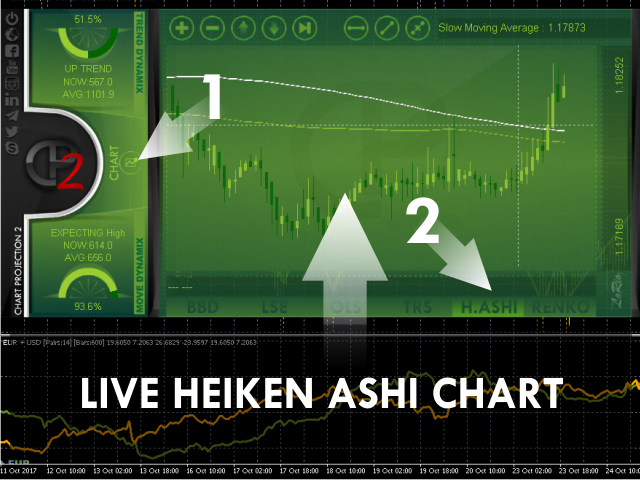
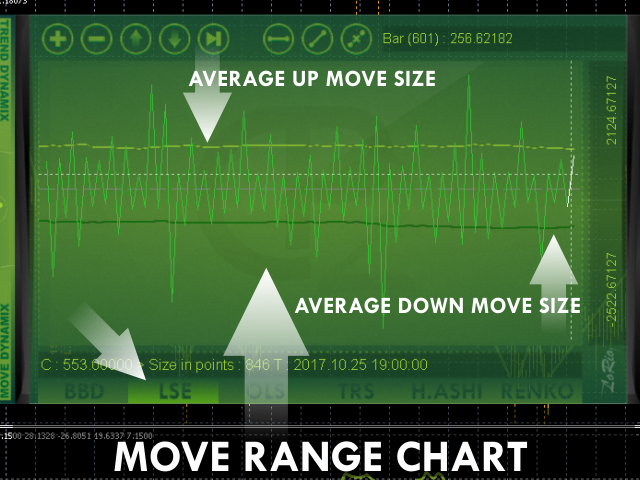
- Extra charting abilities with 6 chart types
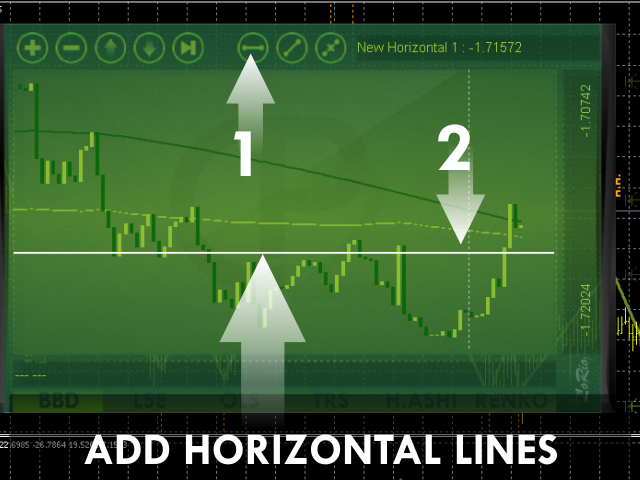
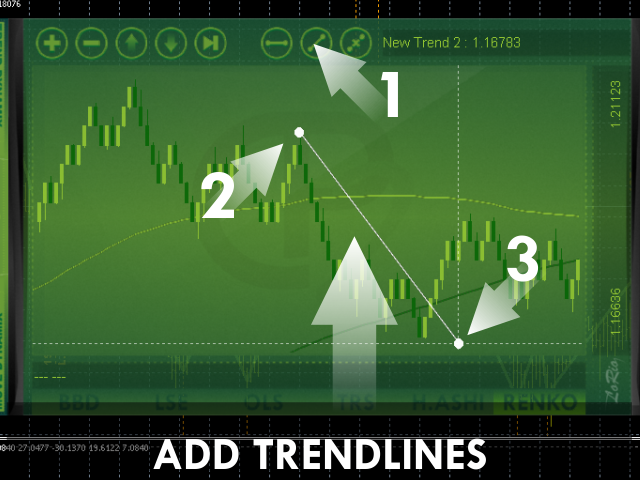
The ability to change the projection live on the chart has also been introduced
The indicator does not use :
- AI , artificial intelligence
- chatGPT , claude , deepseek
- neural network
- reinforcement learning
- genetic algorithm
- OpenAI


I really like this idea of dynamic trading, great indicator and profitable. I use it on a VPS because my PC is slow and needs cpu. One of the best and not negligible thing that it is free. Thanks to the author