Instant Navigator
- Experts
- Eric Veilleux
- Version: 1.1
- Activations: 10
Rent 1 month only 10$ a whole year only 25$, EA made to instantly navigate through 14 instruments/8 timeframes with shortkeys and arrows and display account information right on the chart and many more features like displaying principal labels in your own language!!
- Up and Down key: navigate super fast through up to 14 instruments
- Left and Right key: navigate super fast through all timeframes
- 1 to 9 keyboard numbers: go directly to timeframe M1,M5,M15,M30,H1,H4,D1,W1
- type E : cycle instantly between Euro denominated pairs in your list
- type U : cycle instantly USD/CAD USD/JPY USD/CHF instruments in your list
- type A,B,C,E,G,L,N,U,W,X to instantly cycle between instruments starting with those letters in your list
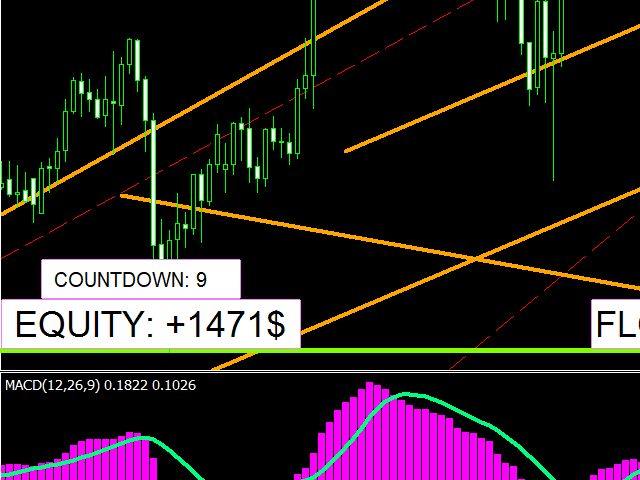
- hit >>> button to start a countdown to next instrument automatic change, hit once for 150 seconds countdown, twice for 50 sec, three for 20 , 4 times for 10 seconds, hit another time to stop automatic chart change
- type H to instantly draw a selected horizontal line ready to place where you want it
- type T to instantly draw a selected trend line ready for adjustment
- hit "t" to display active trades on the current instrument
- hit "T" to display all active trades
- hit "X" to close a position
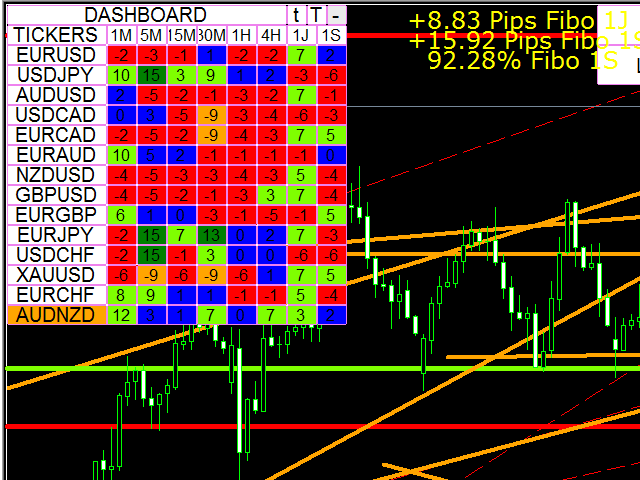
- hit "+" to display scoring board
- hit "-" to close scoring board
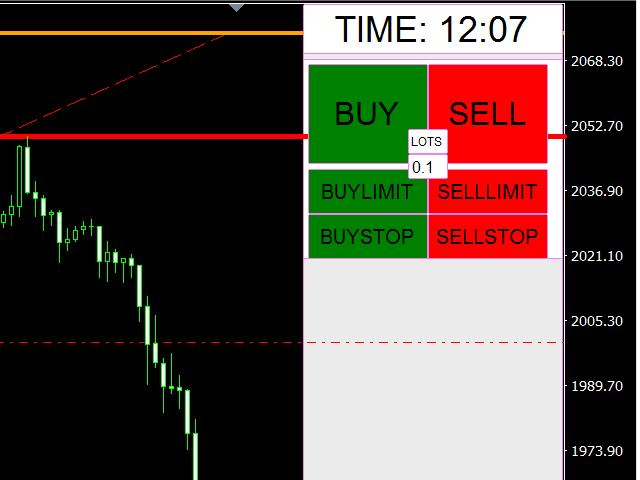
- hit the Buy, Sell, Buylimit, Selllimit, Buystop or Sellstop to instantly open a position with predefined parameters
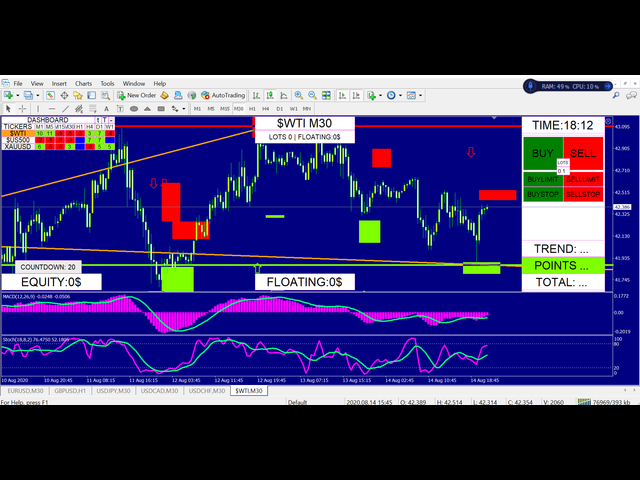
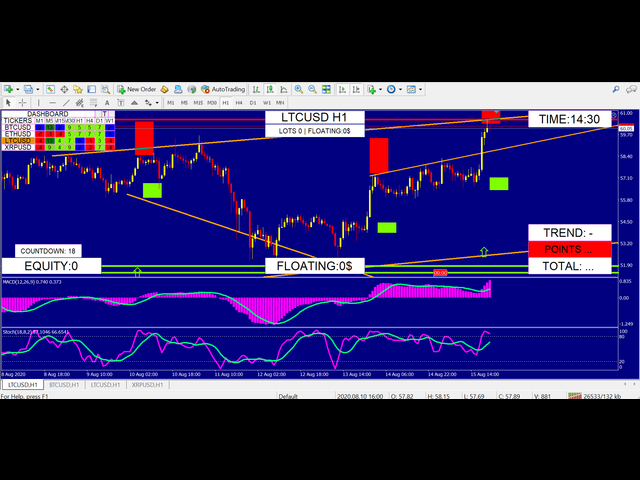
It provides a multi instrument scoring point for timeframes from M1 to W1 with color codes (you have to open a tab for each instrument to get the score points) and a display of current positions with an X to close them. It also displays equity, floating profit and floating profit for current instrument plus current lot position substracting sell orders to buy orders.
Also displays Time with a paramater to adjust to your local time or other time if you wish and have a One click trading function for Buy, Sell, Buy limit, Sell limit, Buy Stop and Sell Stop for the parameters you insert it.
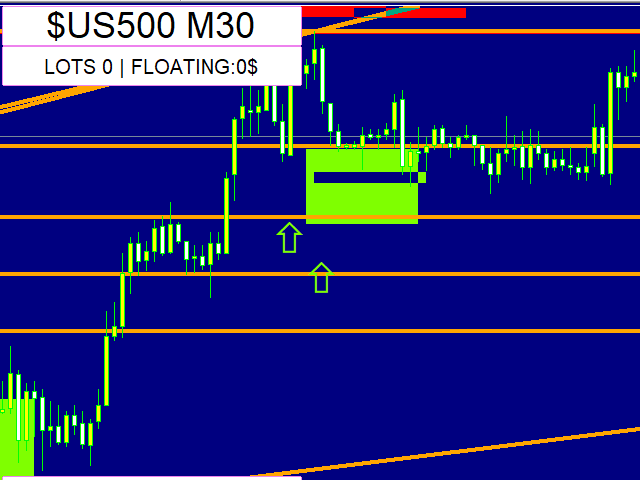
It also Automatically draws trend lines for support and resistance, horizontal lines for high of day/week, fibonacci and draws rectangle for possible zones of overbought and oversold.
It also has a Button to automatically cycle through the maximum of 14 intruments you choose to with countdown of 150, 50, 20 or 10 seconds allowing you to visualize all those instruments with a fresh mind looking for that best trade while doing other things having a quick laid back look when it changes.
Highly customizable you can choose to display or not those objects and set color for chart background, display background, text color, score colors, selection color. You don't need the Terminal anymore as trades can be closed directly on the chart and information is also clearly displayed saving you space for your charts and to have a clear mind.
