UPD1 Murrey Math Levels
- Indicators
- Vitaliy Kuznetsov
- Version: 1.35
- Updated: 12 December 2023
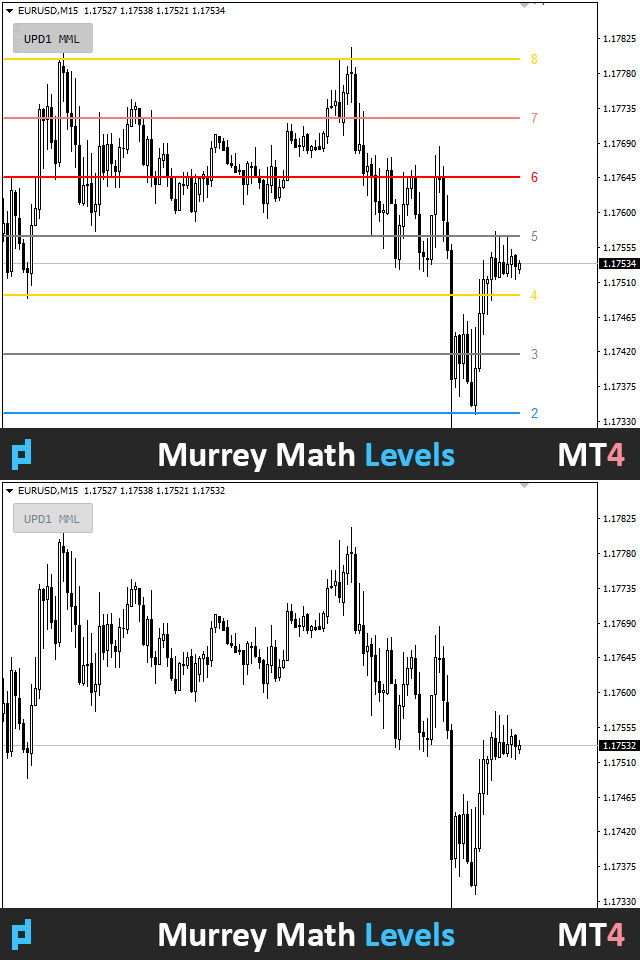
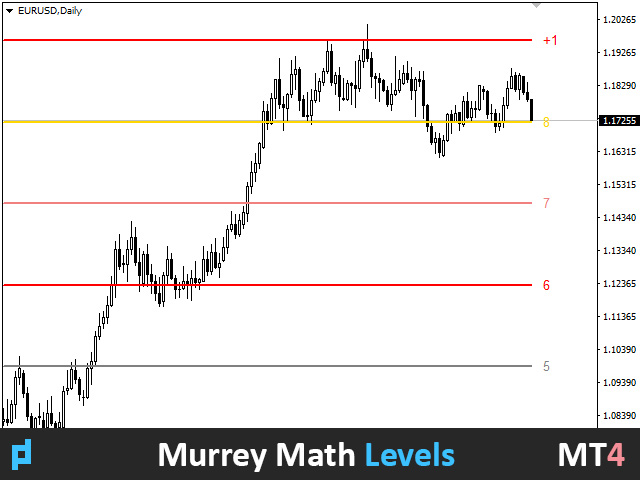
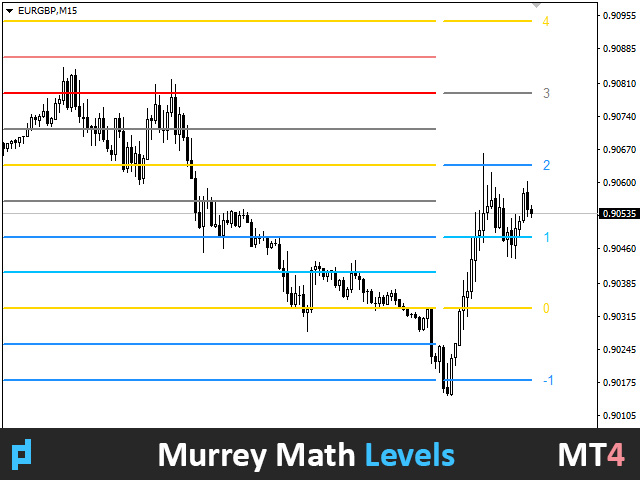
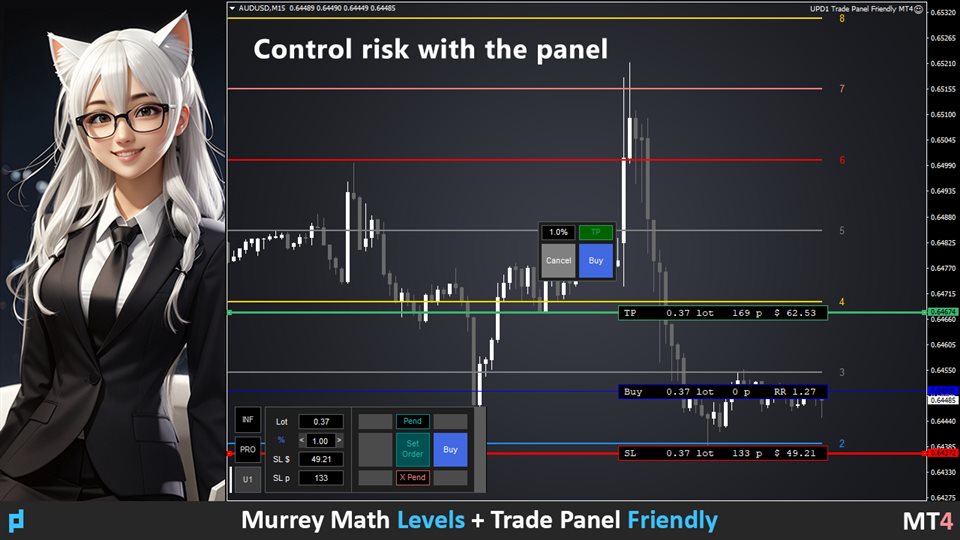
Murray's mathematical levels are based on observations by Gann and his theory of the squareness of prices. According to Gann, the price moves in 1/8 of the range.
These 1/8 allow us to get different resistance and support levels for a given chart, which have their own characteristics.
After a breakout of -2 or +2 levels, or with a decrease in volatility, they are rebuilt.
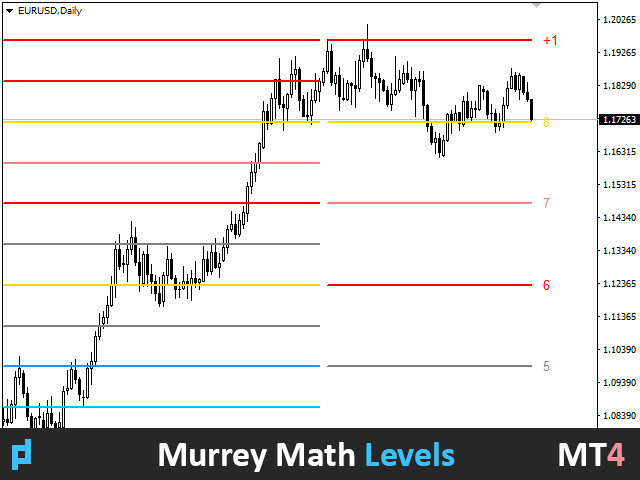
You can choose which period to display (current or entire history). All lines are drawn through buffers.
Blog-Link - Murrey Math Trading with UPD1.
Input parameters.
Period - specify the period for which the levels will be calculated.
History - choose the way of displaying history (current / whole history).
Bars Count - indicate how many bars to draw line / history.
Visual Button - whether or not to display the button.
Corner - select anchor angle.
Indent X - x-axis offset in pixels.
Indent Y - y-axis offset in pixels.
Label Visual - whether or not to display the level label.
Label Font Size - specify font size.
Label Shift Bars - set the indent in bars from the level.
Label Tooltip - whether or not to display a tooltip when hovering over a level.
Label Name - full or short.
Levels Color - indicate color for levels.
Line Width - indicate the width of levels.
Line Style - indicate the style of levels.










Thank you very much.