Multi Timeframe MTF Visual Stochastics Display
- Indicators
- LEE SAMSON
- Version: 1.2
- Updated: 18 October 2024
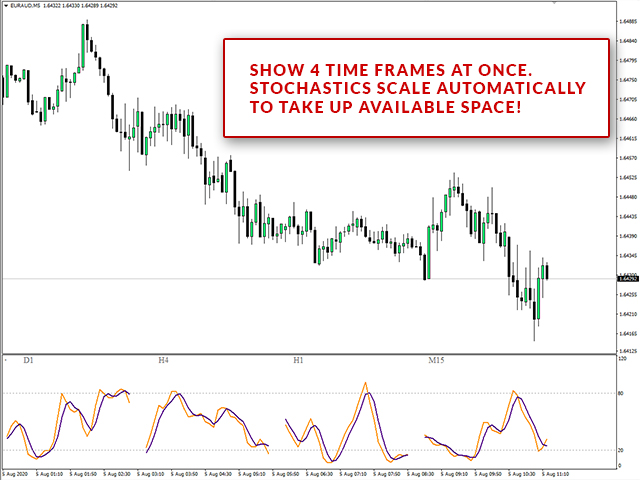
AT LAST! A stochastic indicator for MT4 that shows multiple time frames on one chart! See the actual position of the main and signal lines in 4 separate time frames instantly to help you make educated trading decisions.A true MTF stochastic indicator for traders that need to see visually what the indicator is telling them on multiple time frames, no arrows that just point up or down or numbers displayed.
No more flicking between time frames to see where other stochastics are positioned! Stay on your favorite time frame and get an overview of them all!
No more wondering if that up or down arrow on other stochastic indicators is the main or signal line, or what angle it's really pointing!
No more MTF stochastics that just don't look right as hey are stretched out or inaccurate and take up valuable chart space!
See whether a cross has happened or not on all timeframes RIGHT FROM YOUR TRADING CHART!
FEATURES
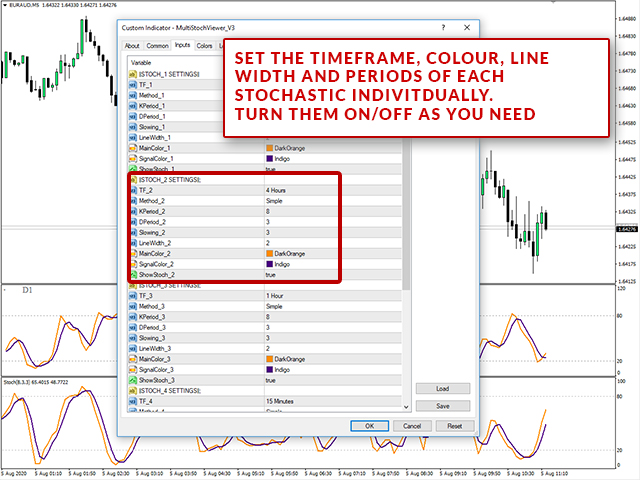
- Choose your preferred time frames ( up to 4 in total) from M1 to Monthly
- See the latest portion of the stochastic for each one displayed side by side
- Fully customizable colours, levels and parameters as per the stock indicator that comes with MT4
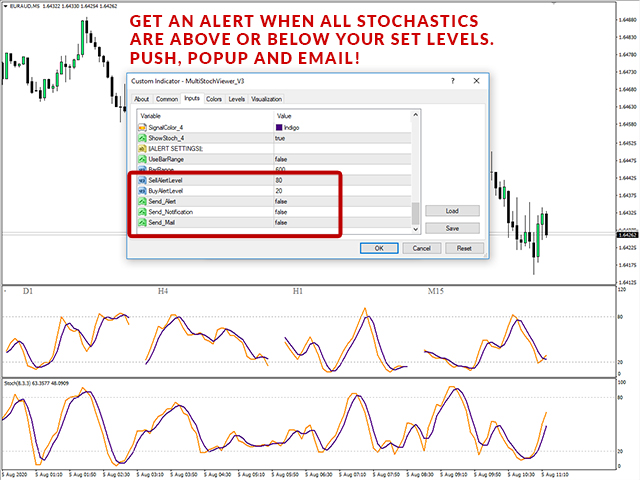
- Setup alerts to tell you when all time frames you have chosen are overbought or oversold
- Integrated popup, push and email alerts
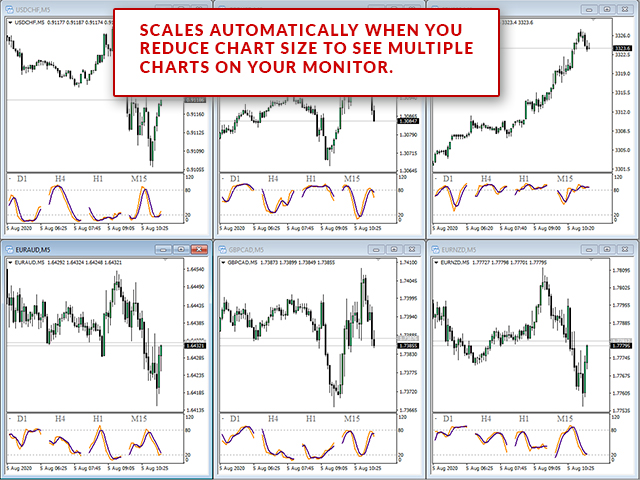
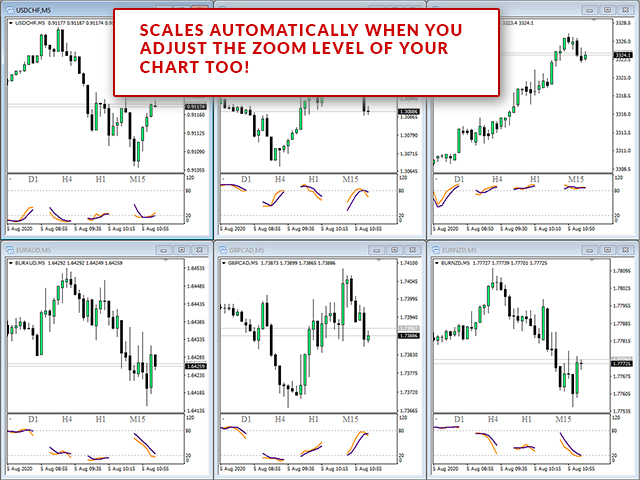
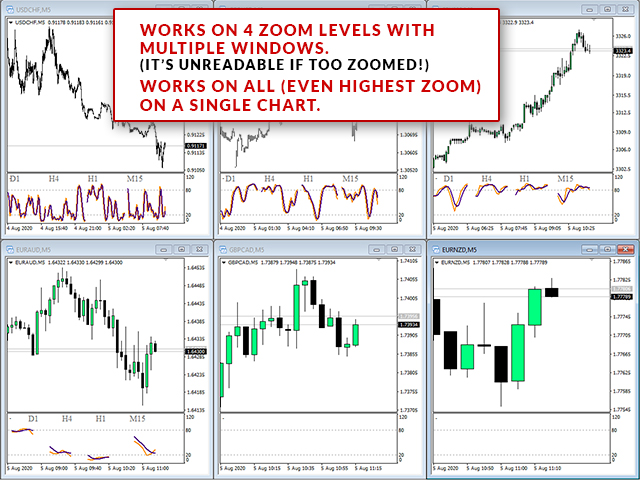
- Scales with your chart so each stochastic takes up 1/4 of the available space on screen
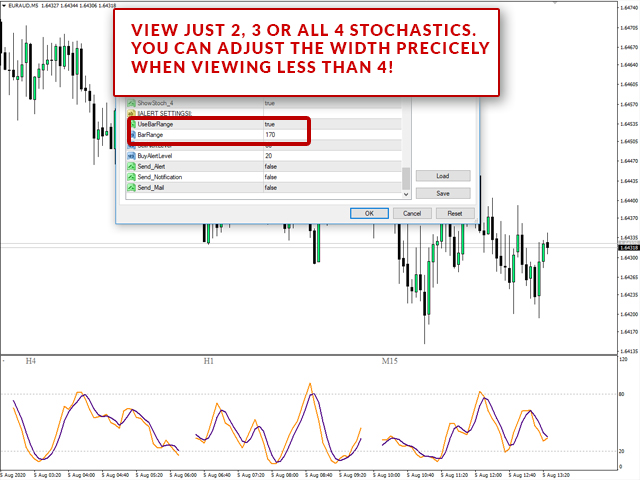
- Choose to have 2, 3 or 4 stochastics displayed and manually set the width each takes up.
- Zooms in and out with your main chart to keep in line with your preferred view of the market
- Choose the same parameters for multiple time frames or set them all to the same time frame and show different stochastics with different parameters
You've heard the phrase BUY LOW and SELL HIGH! Stochastics are a great indicator of where to do that, especially when multiple time frames agree. Single stochastics on lower time frames especially cannot be relied upon.
NEVER buy when stochastics are over 80 and NEVER sell when they are below 20.
Stochastics form a key part of many systems and oscillators have always been used to help identify market waves and moves. Most professional traders use multiple time frame analysis to time their entries and spot key areas to get in and out of the market.
Having 4 key time frames displayed instantly on one chart for traders that use multiple time frame analysis and stochastics is priceless.
Common Strategies & How To Trade With the MTF Stochastics Indicator
The MTF stochastics indicator can be used alone or in conjunction with your other favorite indicators.
Exhaustion Strategy
On it's own a great strategy is to use stochastics for identifying when pullbacks are likely to occur.
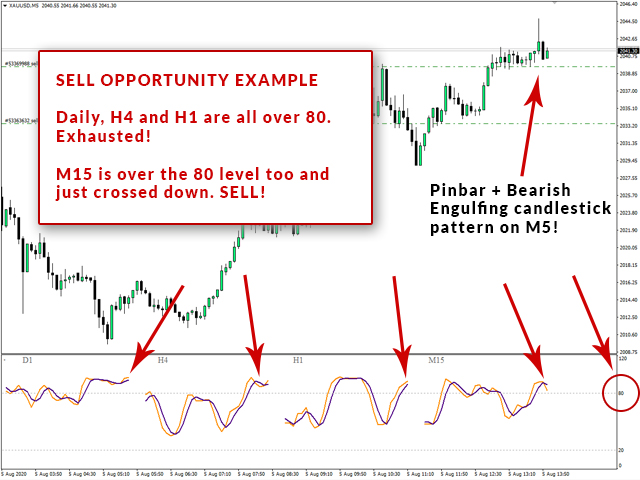
- When all selected time frames are either overbought (above the 80 level) or oversold (below the 20 level) look for price action signals on the lowest time frame.
- The indicator will alert you when the stochastics are in these areas
- Price action signals could be a pinbar, engulfing candle or any good candlestick formation that traditionally signals a reversal.
Trend Pullback Strategy
Us the highest time frame to signal trend direction to you. e.g. M15, H1, H4 or daily time frame for trend.
- Us the highest time frame for general trend direction. Only take trades in the direction this time frame stochastic is heading. If stochastics have recently left the oversold area (under 20) crossed and are heading up you have a temporary uptrend.
- Use the lower time frames to time entries into the market in the direction of the higher trend.
- Wait for the lower time frames to be oversold (if trend direction is up) and buy when you get a cross on the lowest time frame stochastics or a good price action candlestick formation.

