Version 1.34
2022.02.01
1. Fixed Correct Spread Cost Calculation
Version 1.33
2020.09.24
1. Fixed Monte Carlo Simulation not running properly in Forward Simulation.
Version 1.32
2020.09.14
1. Forward Simulation feature added.
2. TP and SL level now are marked with a small line once a trade is placed.
3. TP and SL text are aligned with the TP and SL lines.
4. Action for undetermined trade is now available in the inputs(this is what the backtester will do when you have a trade that has both SL and TP on the same candle).
Version 1.31
2020.09.04
1. Save and Load Function added.
2. On Chart mouse over switch for backtesting on/off is available, can be turned on in the input settings, it is called "Onchart Backtest Dot".
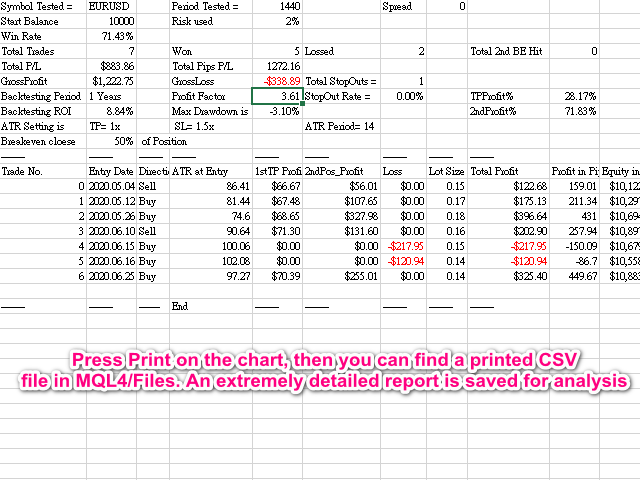
3. Trade Frequency is now added in the printed CSV file, you can now see your trading frequency is "1 trade per x Bars"
Version 1.30
2020.08.30
1. Detailed Live stats now also displays your Trading frequency, Bars backtested divided by No. of Trades excuted
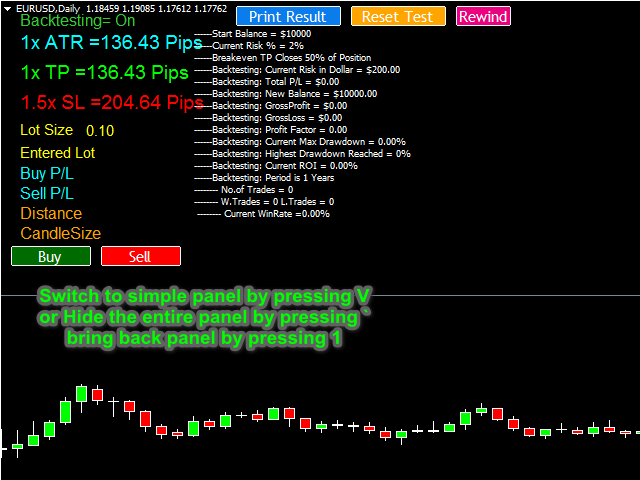
2. Ultra Simple Panel is now an option in the input settings, you can chose to use it instead of the standard simple panel to have even less information displayed on the chart.
3. Minor Monte Carlo Simulation Bug Fixed.(Riskscore was not showing up properly before and people always get categorized as "very safe")
Version 1.29
2020.08.25
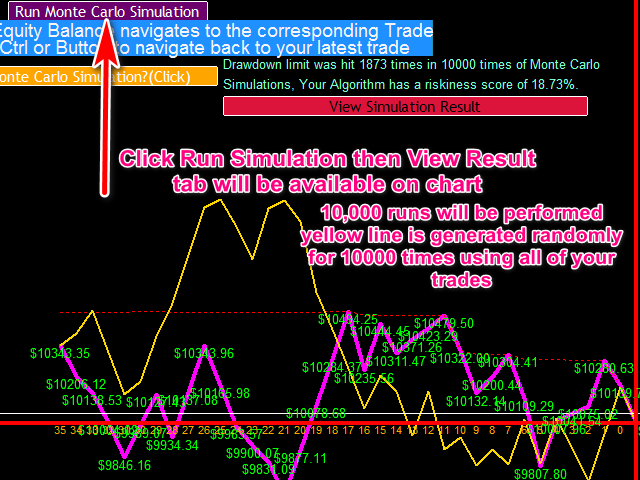
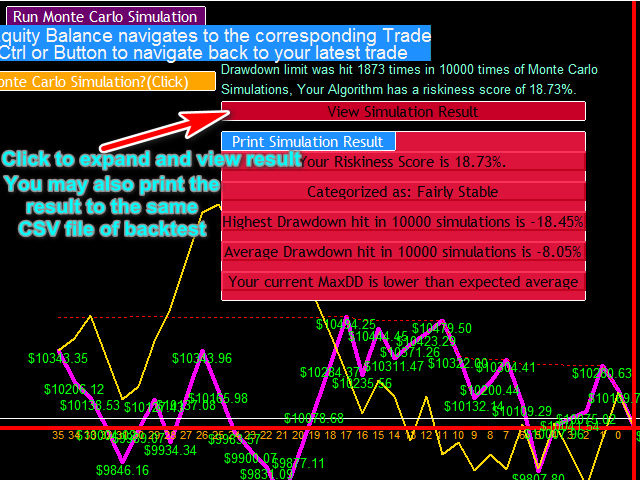
1. Monte Carlo Simulation function added.
2. G key is now assigned for running Monte Carlo Simulation after you've done your backtest, note that it has to be done inside the equity overview mode.
3. Crosshair now automatically disable itself when your mouse is on top of Print, Reset, Rewind, View Equity, Monte Carlo Buttons.
4. A confirmation message box now pops up when you click on reset button, this is to prevent people from clicking on the reset button accidentally and reset the whole progress by mistake.
5. Fixed a bug where the backtester freezes when backtesting year is reduced to 0 while you are progressing. Now pops an alert telling you year cannot be reduced to 0.
Version 1.28
2020.08.19
1. Shift Key now Hide/Show TP, SL or breakeven Text on chart. Ctrl Key is now used for Equity Curve overview.
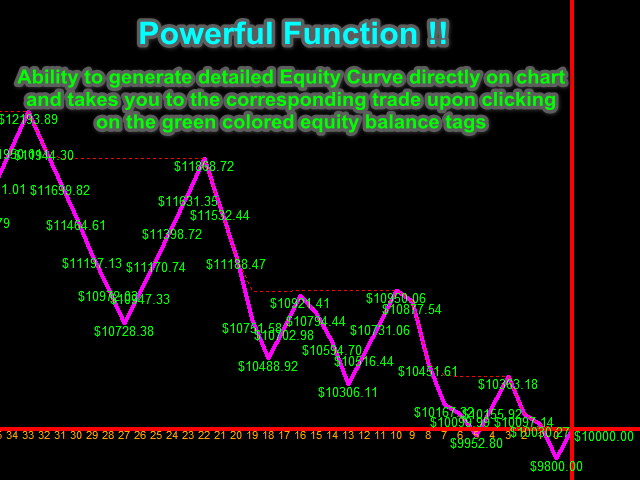
2. Equity Curve overview now supports all balance level and is fully automatic(No manual scrolling or adjusting chart scale anymore), can be viewed by pressing Ctrl or clicking on the "View Equity" Button
Press Ctrl/or Button to Hide/Show Equity Curve. Upon Hiding the Equity Curve, the backtester will take you right back to where your last trade where.
3. G key for hiding Big Horizontal Axis of Equity Curve is now removed. Equity Curve now only shows when it is called by Key press or button press.
4. Cleaned up comment section and updated.
Version 1.27
2020.08.18
1. Now shows line for where 1st and 2nd position exited, color can be changed in the input settings, if prefer no lines can set color as None.
2. Simulation mode added, can now be turn on or off in the inputs, or by simply pressing B on the keyboard. You can adjust if you want to block 1/4 of the right screen, or block all the way to the middle. You can progress the chart by pressing F12, one candle at a time.
Version 1.26
2020.08.16
1. Fixed where live risk increment on simple panel not changed accordingly when inputs are altered.
2. Hide/Show Horizontal Equity Line using G only. (used to be G for hide, F for show).
3. Now you can reset your entry line or exit line right away using F key on keyboard without continuous mouse click.
4. TP and SL Level on both directions now are displayed upon first entry candle click. (can be turned off in the inputs).
Version 1.25
2020.08.14
1. Now displays "News Event Name and its corresponding currency" in the live stats if you have purchased and installed my NNFX News Event Tool. Can be switched on and off by F5 key, or in the input settings.
Version 1.24
2020.08.13
1. Now includes option to print out entry price, exit date, exit price for 1st and 2nd position in the input settings.
2. Minor Bug fix.
Version 1.23
2020.08.11
1. Press Q to skip the chart to the starting date of the backtest you've selected instead of scrolling.
2. Press E to skip the chart to the ending date of the backtest you've selected instead of scrolling.
Version 1.22
2020.08.11
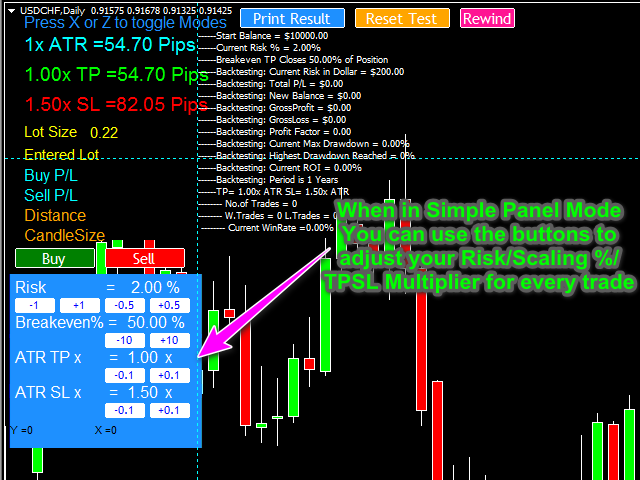
1. Simple Panel by Press V now comes with a small panel that allows you to
adjust Risk/Scaling out %/TP&SL Multiplier for every trade using buttons instead of Hot Keys on the Key board.
2. Original Hot Keys for Risk, Scaling up %, TP&SL multiplier adjustments remains intact.
3. Small Panel can be moved by W, A, S, D keys, X and Y coordinates are displayed on the panel, you can type the coordinates
in the input settings, this way small panel will show up in the location where you preferred without moving it again.
Version 1.21
2020.08.09
1. Fixed decimals of ATR, TP and SL on chart.
2. Fixed a bug where risk used for every trade is not printed properly.
3. Scaling out %, TP multiplier and SL multiplier for every trade is now printed in CSV.
Version 1.20
2020.08.09
1. Now include ability to adjust TP and SL multiplier as you backtest
Press 8 = Decrease TP Multiplier
Press 9 = Increase TP Multiplier
Press 0 = Decrease SL Multiplier
Press "equal sign" to Increase SL Multiplier
2. Number of Unit of Increment for the above function can be adjusted in the input settings. Default is 0.1 Multiplier Increment.
Version 1.19
2020.08.05
1. Fixed decimals on breakeven percentage live stats
Version 1.18
2020.08.05
1. Ability to adjust TP scaling out percentage during backtest. Press 6 decrease, Press 7 increase.
2. Number of unit of increment on live Risk or Scaling out percentage can be changed in the inputs.
3. Fixed bug where H suppose to decrease risk instead increasing risk.
4. Advanced Print Options by pressing 5 on/off. Allows you to print your current backtest stats using a different start balance
and risk %. However, with certain limitations displayed when pressing 5.
5. Number of unit of increment on advanced print for Risk and Balance can be changed in the inputs. (button numbers)
Version 1.17
2020.08.04
1. Vertical lines for every trade's entry and exit can now be displayed/hidden by pressing 3 key.
Version 1.16
2020.08.02
1. CrossHair now last until 2nd exit candle is selected.
Version 1.15
2020.08.02
1. CrossHair function is now added, can be switched on or off in the inputs, or press 2 to switch.
2. Cleaned up some decimals in the CSV file.
Version 1.14
2020.08.02
1. Chalked Trades changed to 2nd Position Hit BE or not.
2. Loss now has a separate column in the printed CSV.
3. 1st TP, 2nd Position and Loss now can be customized to print in Pips or Dollars, Set in inputs or Press C to switch pips or
dollars.
4. Sound effect added for Buying or Selling trades, Rewind, Switching Modes, Reset and when loading indicator. Can be switched
off in the input settings.
5. Trade Number in the printed file adjusted to the first column.
Version 1.13
2020.08.01
1. ATR at Entry Bar is now included in the printed CSV for every trade.
2. 1st Position TP Profit and 2nd Remaining Position Profit is now printed in the CSV for further analysis.
3. % of 1st Position Profit out of Total Profit, % of 2nd Remaining Position Profit out of Total Profit is now Printed.
4. Trades that did not Hit SL nor TP is now marked as Chulked Trades in the CSV.
Version 1.12
2020.07.30
1. Minor Bug fixed.
2. Press Tab for printing has been brought back.
3. Now has a comment to advise you what key to press for bring back live stats when it is hidden.
Version 1.11
2020.07.30
1. Spread setting is now available.
Version 1.10
2020.07.30
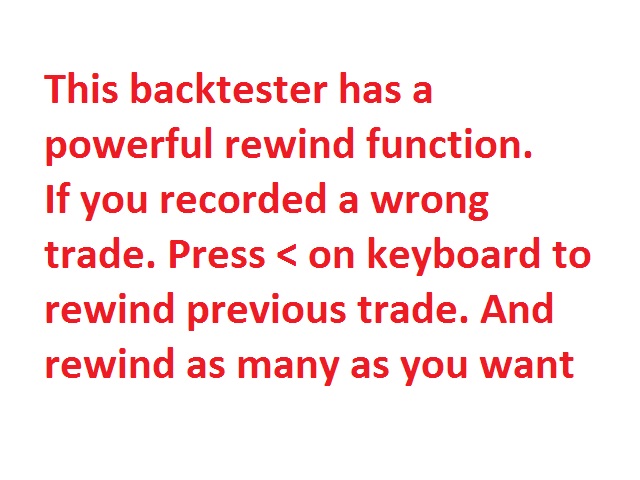
1. Buy, Sell, Rewind, Reset and Print function now have buttons on the chart.
2. Old hotkey for Reset and Print has been removed. Buy, Sell and Rewind hotkey remains.
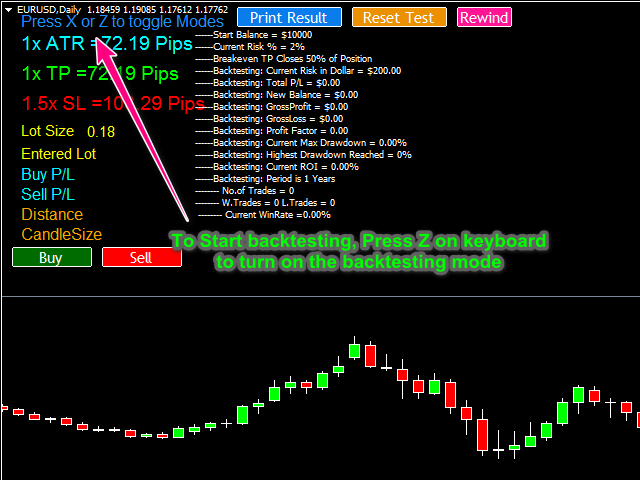
3. Live stats panel now can be switched to simple panel with only important stats By pressing V.
4. CSV file format now is more tidy.
5. Fixed a bug where attempting to print results without any trades will cause the backtester to froze.
6. Slightly adjusted live stats position.
7. Buy and Sell button have two display location choices.
Version 1.9
2020.07.26
1. CSV File now prints Buy or Sell for a trade, also prints Trade No.
Version 1.8
2020.07.25
1. Lot Size for each trade is now recorded in the CSV File.
2. ATR Period is printed in the CSV File.
3. ATR Period is displayed on live stats.
4. Total Net Pips is printed in CSV File.
5. Equity Horizontal Line can now be hidden by pressing G, bring back by F Key.
6. Font Size for ATR Text, Lot Size Text, BuySell P/L Text and Pip Distance Text are now adjustable in the inputs.
7. Trailing options are now available upon first click of entry, Mouse over to the candle where trailexit happens then
Press M to trail for Buy Trade, Press N to trail for Sell Trade. Then continue to click to save trades as usual.
8. Trailing parameters are in the inputs.
Version 1.7
2020.07.24
1. Update Stop-out Rate formula in CSV File.
Version 1.6
2020.07.24
1. Printed CSV file now marks trades that are stopped out, also prints total number of trades stopped out.
2. Fixed where closing 100% of position at TP records incorrect Pips into the printed CSV file.
3. SL, TP and BE Text on chart during backtesting mode can now be hidden by Shift Key, bring back by Ctrl Key.
4. Font size of Buy and Sell Text on chart during backtesting mode can now be adjusted in the input settings.
5. Lot size are now all adjusted to your account currency.
6. Equity Curves Overview on the chart adjusted to proper scale for all commodity and now requires very little zooming to see
all of it.
7. Fixed sometimes where the live stats and printed CSV file displaying too many decimals.
8. Fixed clicking on a bar at the very end of a chart where there are not enough bars for atr calculation will cause the
backtester to froze, it now alerts that there is no atr value at where you clicked.
9. Fixed sometimes backtester does not get the correct TP and SL.
10. Now alert you if the lot size of a trade is below minimal required lot by your broker.
Version 1.5
2020.07.23
Fixed where some object are not deleted when pressed R to reset
Version 1.4
2020.07.23
1. Fixed where BE candle for buy not showing up.
2. Now printed file includes, equity changes and peak balance reached and will now print the exact number of trades backtested.
Version 1.3
2020.07.22
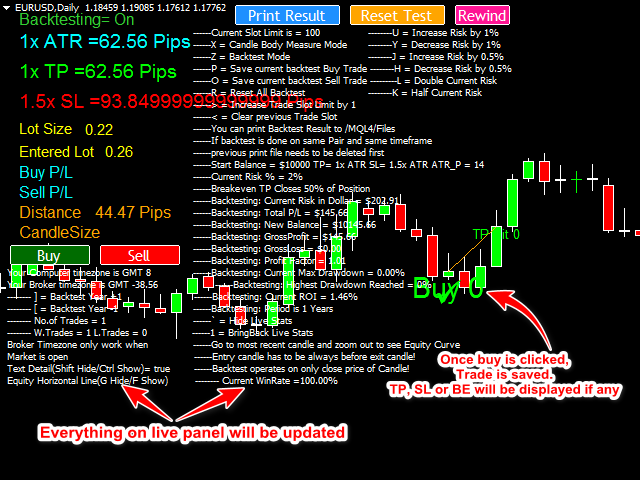
TP candle, SL candle and BE candle now is marked.
Version 1.2
2020.07.22
1. Now displays Buy or Sell on chart at the entry candle of the trade you saved.
2. A tick or a cross is displayed at the entry candle of the trade you saved, depending whether it was a loss or a win.
3. Entry Dates of every trade saved are now printed in the CSV File.
4. Pips won per trade is now printed in the CSV File.
5. Changing the Measure Mode name to Backtest Mode to avoid confusion.
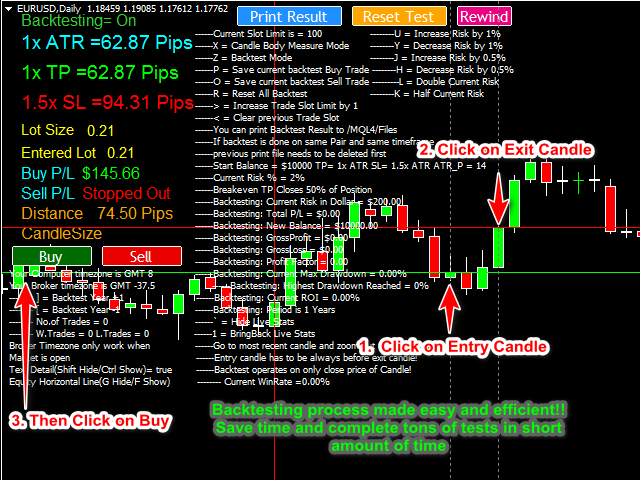
6. ATR, ATR TP and ATR SL are now locked upon first click of entry candle during backtest mode.
7. If exit candle is not clicked yet during backtest mode, the distance will display as Pips distance between entry candle close
and current mouse location, it is dynamic and updated as you move your mouse.
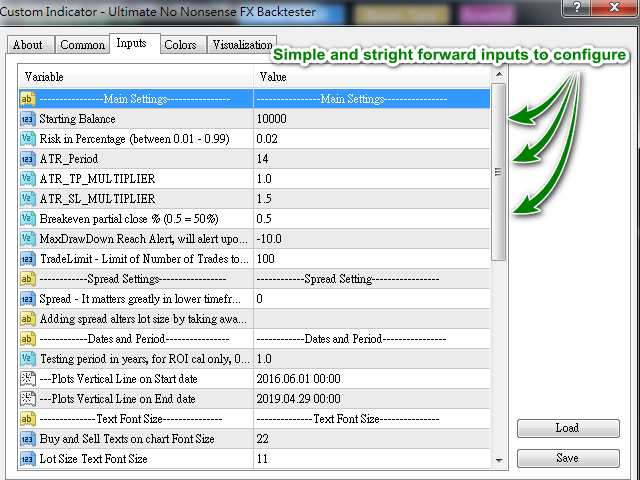
8. Backtesting Start Date and Backtesting End Date is now a input, and is for displaying vertical lines on the chart only. So you can see from the chart more clearly where you started and ended.
Version 1.1
2020.07.20
Adjusted comment section to be more visible on the chart.




























Nice backtester, couldn't be simpler or more informative! I got my money's worth out of it within the first week of using it.