• Overview
  • Reviews
  • Comments (95)
  • What's new

Advanced Harmonic Patterns

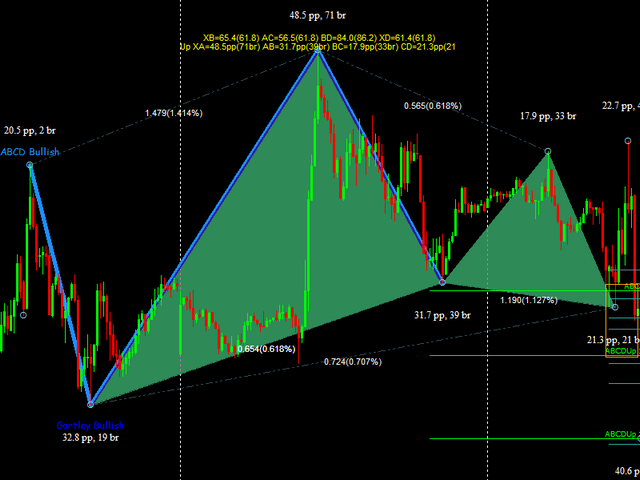
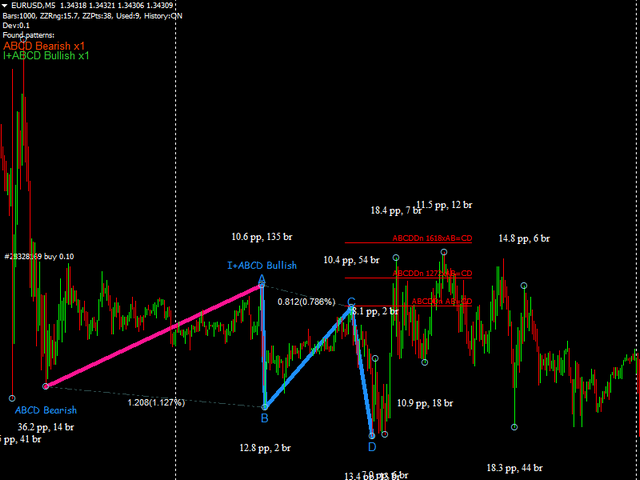
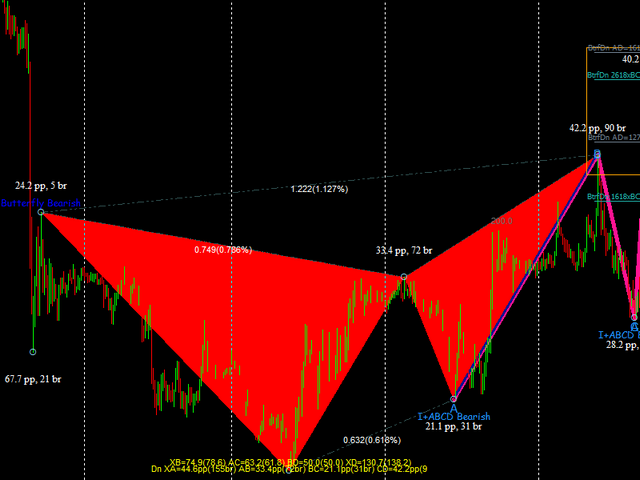
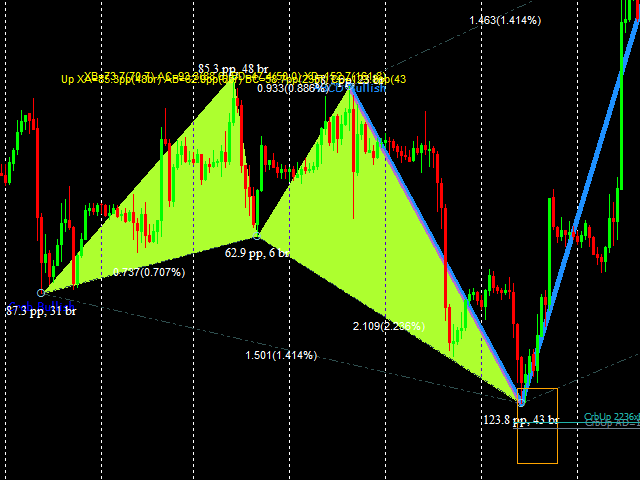
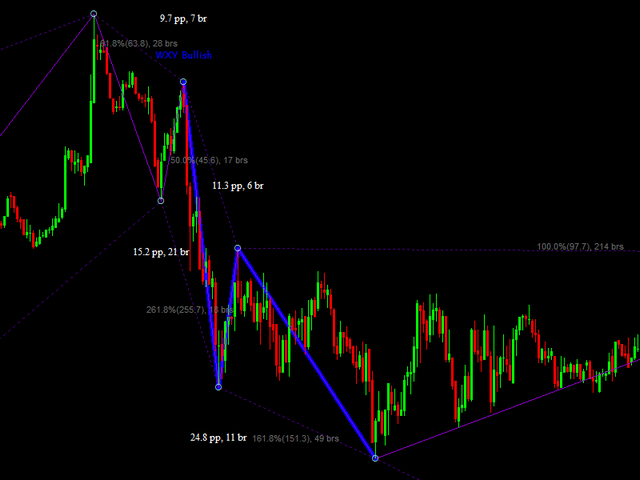
The indicator displays harmonic patterns on the chart based on Dynamic ZigZag (https://www.mql5.com/en/market/product/5356) and is almost a complete analog of one of the versions of well-known korHarmonics. The indicator recognizes the following patterns and their varieties: ABCD, Gartley (Butterfly, Crab, Bat), 3Drives, 5-0, Batman, SHS, One2One, Camel, Triangles, WXY, Fibo and Vibrations. Only display of ABCD and Gartley patterns is enabled in the settings by default. The reverse line allows defining the moment of fixing the opposite vertex. Plenty of customizable parameters are provided.

МetaТrader 5 version: https://www.mql5.com/en/market/product/5195

Describes of the parameters available for download.

Recommended products
TrendSign
Joel Protusada
The indicator has the following features Predictive Trend (Histogram) - it uses an advanced predictive probability and statistics calculation plus linear regression to know the possible trend. This must be used with at least 3 timeframes for a more accurate reading of the trend: D1, H4, H1. In some cases (subjective), you may want to use M5 for a more precise reading. Velocity (Dotted Line) - Green dotted line indicates a speed of price movement upward. Red dotted line indicates a speed of price
This is an indicator for additional signal filtering. It can be used as an additional filter in a trading system. The indicator does not redraw its data and can be used both in forex trading and with binary options. It has 3 operation modes and flexible sensitivity settings. The indicator uses multiple buffers, therefore it can be easily used in various Expert Advisors.
This software tool is designed to streamline the process of creating horizontal trend lines and rectangles in your choice of five customizable colors. Drawing precise horizontal trend lines in MT5 can be challenging, but with this indicator, you can effortlessly create them in the colors that suit your preferences. Additionally, our tool provides a clear display of the price levels associated with the horizontal lines you draw. We value your feedback and hope you find this tool to be a valuable
Crazy Dancing moving RES/SUP Levels Automatic redrawing of moving Supports and resistances levels  to indicate price breaking supports (signal SELL)  or breaking resistance levels (signal BUY) Very simple appearing indicator but very clever and smart too !!!! Main Inputs: # of bars for the support and resistances levels + the initial shift from start + moving average for filter signaling Smaller values for bars /shift inputs when using Higher Time frames (D1-H4) and the reverse higher values for
CyberZingFx Volume Plus
Afsal Meerankutty
4.94 (16)
Advanced version of CyberZingFx Volume Plus, the ultimate MT4 indicator for traders seeking highly accurate buy and sell signals. With an additional strategy and price action dot signals that enhances its effectiveness, this indicator offers a superior trading experience for professionals and beginners alike. The CyberZingFx Volume Plus Advanced version combines the power of volume analysis and historical price data with an additional strategy, resulting in even more precise and reliable signals
Introduction Harmonic Patterns are best used to predict potential turning point. Traditionally, Harmonic Pattern was identified manually connecting peaks and troughs points in the chart. Manual harmonic pattern detection is painfully tedious and not suitable for everyone. You are often exposed under subjective pattern identification with manual pattern detection. To avoid these limitations, Harmonic Pattern Plus was designed to automate your harmonic pattern detection process. The functionality
The indicator provides a superior alternative to price action analysis. It enables the identification of normalized patterns, which are then transformed into a graphical representation to forecast future steps within a time series. In the top-left corner, you'll find information regarding the expected prediction accuracy, determined through a complex MSQE calculation. You have the flexibility to adjust the time window, making it easy to validate the indicator's performance. Additionally, you can
Master Scalping M1 is an innovative indicator that uses an algorithm to quickly and accurately determine the trend.The indicator calculates the time of opening and closing positions, the indicator's algorithms allow you to find the ideal moments to enter a deal (buy or sell an asset), which increase the success of transactions for most traders. Benefits of the indicator: Easy to assemble, does not overload the chart with unnecessary information. Can be used as a filter for any strategy. Works on
Elliott Wave Trend was designed for the scientific wave counting. This tool focuses to get rid of the vagueness of the classic Elliott Wave Counting using the guideline from the template and pattern approach. In doing so, firstly Elliott Wave Trend offers the template for your wave counting. Secondly, it offers Wave Structural Score to assist to identify accurate wave formation. It offers both impulse wave Structural Score and corrective wave Structure Score. Structural Score is the rating to sh
Introduction to Smart Renko The main characteristics of Renko Charting concern price movement. To give you some idea on its working principle, Renko chart is constructed by placing a brick over or below when the price make the movement beyond a predefined range, called brick height. Therefore, naturally one can see clear price movement with less noise than other charting type. Renko charting can provide much clearer trend direction and it helps to identify important support and resistance level
Are you tired of channeling? This indicator is designed to draw channels. Triple graphics channels, automatically installs 3 different graphics channels. These channels are shown on a single graphic. These channels are calculated by a number of different algorithms. Automatically draws on the screen. You can select three time zones. Parameters Period1 - from here you can select the first period. It can be selected from 1 minute time period to monthly time period. Period1_Channel_Color - period
The indicator displays Renko bars on the chart, uses them to plot the ZigZag - trend lines connecting the local Lows and Highs of the price movement, and highlights them based on the Gartley patterns, showing the potential price reversal points. Renko - specialized display of the price action, in which the graph is displayed not every bar of the time frame, but only under the condition that the price had passed more than the specified number of points. Renko bars are not bound to a time frame, s
TopBottom Checker
Oleg Rodin
4.89 (9)
TomBottom Checker is a leading indicator which predicts tops and bottoms. The indicator can be used with any forex pair and time frame from M1 up to D1. PLEASE CONTACT ME AFTER PURCHASE TO GET MY TRADING TIPS PLUS A GREAT BONUS! The indicator can be used as a standalone trading system or it can be a part of any system which you're currently using. This is because the indicator deals with such market aspects which are very important for any strategy. The indicator's signals can be used for entr
The indicator detects and displays the 5-0 harmonic pattern on the chart according to the scheme provided in the screenshot. The pattern is plotted by the extreme values of the ZigZag indicator (included in the resources, does not require additional installation). After detecting the pattern, the indicator notifies of that by the pop-up window, a mobile notification and an email. The indicator highlights not only the complete figure, but also the time of its formation. During the formation the f
Harmonics detector  is a precise tool for identifying harmonics patterns.  Allows you to trade with reliable information, making your analysis fast and easy. Pattern detected: Gartley Bat Crab Butterfly Features: Working timeframes: M5, M15, H1, H4; Working symbols: any; Automatic settings; Upcoming patterns: Three dives; Deep Crab AB = CD Elliot Wave's motive wave
This is a self-explanatory indicator - do nothing when the current price in the "fence" (flat) mode. Definition of a flat market: A market price that is neither Up nor Down. The input parameter  counted_bars  determines on how many bars the indicator's lines will be visible starting from the current Bar backward. The input parameter  barsNum  is used as a Period for aqua "fence" calculation.
Introduction to X3 Chart Pattern Scanner X3 Cherart Pattern Scanner is the non-repainting and non-lagging indicator detecting X3 chart patterns including Harmonic pattern, Elliott Wave pattern, X3 patterns, and Japanese Candlestick patterns. Historical patterns match with signal patterns. Hence, you can readily develop the solid trading strategy in your chart. More importantly, this superb pattern scanner can detect the optimal pattern of its kind. In addition, you can switch on and off individu
The indicator detects and displays the AB=CD harmonic pattern on the chart according to the scheme provided in the screenshot. The pattern is plotted by the extreme values of the ZigZag indicator (included in the resources, does not require additional installation). After detecting the pattern, the indicator notifies of that by the pop-up window, a mobile notification and an email. The indicator highlights not only the complete figure, but also the time of its formation. During the formation the
The Penta-O is a 6-point retracement harmonacci pattern which usually precedes big market movements. Penta-O patterns can expand and repaint quite a bit. To make things easier this indicator implements a twist: it waits for a donchian breakout in the right direction before signaling the trade. The end result is an otherwise repainting indicator with a very reliable trading signal. The donchian breakout period is entered as an input. [ Installation Guide | Update Guide | Troubleshooting | FAQ | A
This is the Full Version, to get the free version please contact me. The free version works on “USDJPY” charts. All symbols and time frames scanner. Contact me after payment to send you the User-Manual PDF File. OVER and UNDER Over & Under pattern is an advanced price action trading concept in the trading industry. The Over & Under pattern is more than a confluence pattern or entry technique than a trading strategy. It is a reversal pattern that is created after a significant obvious trend. I
This indicator is based on the original ZigZag provided as a source code example with MetaTrader installations. I rewrote it with some extra features for displaying the “depth” channel and the respective break-outs. It also allows one to observe prior zig-zag points. Optionally, it can alert the user when break-outs occur. The alerts can be simply on the terminal or also via push notifications on a mobile device, with your own custom text.
Fibonacci retracements can be used to draw support lines, identify resistance levels, place stop-loss orders and set target prices. The Advanced Automatic Fibonacci retracements draws automatically all the levels. You have a lot of options to choose. For exemple you can use the tracements of another time frame (MTF) in the current chart, you can also choose between the closest level or less close to draw the retracements. You can also add 2 levels of your choice. You can add levels extensions o
Fibonacci System
Maksim Neimerik
The system applies Fibo levels. Apart from basic Fibo levels (23.6; 38.2; 50.0; 61.8; 100.0;), the EA features custom levels (34.0; 36.0; 64.0; 66.0;). You can decide the levels trading is to be performed from. Sample trade: when the market is bullish and the price rolls back to the levels (as we remember, we select the levels on our own), the EA opens buy orders. The opposite is true for sell orders. The EA can work in three modes. Each of the modes is a separate Fibo levels construction method
Do you want to see the future lines of the ZigZag indicator? This indicator will help you do that because the indicator model is based on two indicators:   Historical Memory   and ZigZag. So it can forecast the ZigZag lines. Very useful as an assistant, acts as a key point to forecast the future price movement. The forecast is made using the method of searching the most similar part in the history (pattern)   to the current one.  The indicator is drawn as a line that shows the result of change o
VR Cub
Vladimir Pastushak
VR Cub is an indicator for getting high-quality entry points. The indicator was developed to facilitate mathematical calculations and simplify the search for entry points into a position. The trading strategy for which the indicator was written has been proving its effectiveness for many years. The simplicity of the trading strategy is its great advantage, which allows even novice traders to successfully trade with it. VR Cub calculates position opening points and Take Profit and Stop Loss targe
The indicator displays market entry arrows based on RSI, MFI, DeMarker, CCI and Multi Stochastic. Inputs period — values of all indicators used. Enable_Alert — audio and text notifications on a trend change. Send_Notifications — push notifications to mobile devices. E-mail alert — email notifications. Make sure to configure email parameters in the terminal settings. Features The indicator does not repaint. The indicator does not recalculate. The indicator works on all timeframes. The indicat
The main idea of this indicator is rates analysis and prediction by Fourier transform. Indicator decomposes exchange rates into main harmonics and calculates their product in future. You may use the indicator as a standalone product, but for better prediction accuracy there is another related indicator - FreqoMaster - which uses FreqoMeterForecast as a backend engine and combines several instances of FreqoMeterForecast for different frequency bands. Parameters: iPeriod - number of bars in the ma
Auto Order Block with break of structure based on ICT and Smart Money Concepts (SMC) Futures Break of Structure ( BoS )             Order block ( OB )            Higher time frame Order block / Point of Interest ( POI )    shown on current chart           Fair value Gap ( FVG ) / Imbalance   -  MTF      ( Multi Time Frame )    HH/LL/HL/LH  -  MTF      ( Multi Time Frame )  Choch  MTF      ( Multi Time Frame )  Volume Imbalance     ,  MTF          vIMB Gap’s Power of 3 Equal High
ZigZag Nrp
Yaroslav Varankin
Zigzag indicator with removed redrawing open a deal Stands when the price crossed the zigzag line If the price crosses  the line from the bottom up, then this is a buy signal If the price crosses the line from top to  bottom then this is a sell signal Stoploss is set at the bend of the Exit the deal by the opposite signal or take profit  Zigzag nrp indicator is easy to set up In it you can choose a  suitable period for yourself Recommended period 3. This is an individual development This tool  
Auto Levels
Yaroslav Varankin
Auto Level this tool is able to determine the levels of support and resistance. search and display when the price has broken through the level and when it pushed off from it. the indicator can be useful if you use resistance support levels in your trading. or the highs and lows of the price, then it will greatly simplify your work and help you more quickly and more accurately determine the rebound or breakdown of the current trend or tendencies level. blue line bottom uptrend red line on top dow
Buyers of this product also purchase
Gann Made Easy
Oleg Rodin
4.88 (97)
Gann Made Easy is a professional and easy to use Forex trading system which is based on the best principles of trading using the theory of mr. W.D. Gann. The indicator provides accurate BUY and SELL signals including Stop Loss and Take Profit Levels. You can trade even on the go using PUSH notifications. PLEASE CONTACT ME AFTER PURCHASE TO GET MY TRADING TIPS PLUS A GREAT BONUS! Probably you heard already many times about Gann trading methods. Usually Gann's theory is very complex thing not only
Atomic Analyst
Issam Kassas
5 (3)
First of all Its worth emphasizing here that this Trading Indicator is   Non-Repainting , Non Redrawing and Non Lagging Indicator   Indicator, Which makes it ideal from both manual and robot trading.  User manual: settings, inputs and strategy . The Atomic Analyst  is a PA Price Action Indicator that uses Strength and Momentum of the price to find a better edge in the market. Equipped with Advanced filters which help remove noises and false signals, and Increase Trading Potential. Using Multipl
Trend Pulse
Mohamed Hassan
5 (4)
Please contact me after purchase to immediately get your PDF strategy + documentation for Trend Pulse !  Official release price of $89  ( 3 /50 copies left). Next price is $199 . Introducing Trend Pulse , a unique and robust indicator capable of detecting bullish, bearish, and even ranging trends! Trend Pulse uses a special algorithm to filter out market noise with real precision. If the current symbol is moving sideways, Trend Pulse will send you a ranging signal, letting you know that it
Scalper Inside PRO
Alexey Minkov
4.75 (60)
An exclusive indicator that utilizes an innovative algorithm to swiftly and accurately determine the market trend. The indicator automatically calculates opening, closing, and profit levels, providing detailed trading statistics. With these features, you can choose the most appropriate trading instrument for the current market conditions. Additionally, you can easily integrate your own arrow indicators into Scalper Inside Pro to quickly evaluate their statistics and profitability. Scalper Inside
Trend Punch
Mohamed Hassan
4.91 (22)
This indicator is unstoppable when combined with our other indicator called  Support & Resistance . After purchase, send us a message and you will get it   for  FREE as a BONUS! Introducing Trend Punch , the revolutionary forex trend indicator that will transform the way you trade! Trend Punch is uniquely designed to provide precise buy and sell arrows during strong market trends, making your trading decisions clearer and more confident. Whether you're trading major currency pairs or exotic sym
Gold Stuff
Vasiliy Strukov
4.9 (269)
Gold Stuff is a trend indicator designed specifically for gold and can also be used on any financial instrument. The indicator does not redraw and does not lag. Recommended time frame H1. At it indicator work full auto  Expert Advisor EA Gold Stuff. You can find it at my profile. Contact me immediately after the purchase to get   personal bonus!  You can get a free copy of our Strong Support and Trend Scanner indicator, please pm. me! Settings  and manual here   SETTINGS Draw Arrow - on off. dra
CURRENTLY 26% OFF Best Solution for any Newbie or Expert Trader! This Indicator is a unique, high quality and affordable trading tool because we have incorporated a number of proprietary features and a new formula. With only ONE chart you can read Currency Strength for 28 Forex pairs! Imagine how your trading will improve because you are able to pinpoint the exact trigger point of a new trend or scalping opportunity? User manual: click here That's the first one, the original! Don't buy a worthle
Currency Strength Wizard is a very powerful indicator that provides you with all-in-one solution for successful trading. The indicator calculates the power of this or that forex pair using the data of all currencies on multiple time frames. This data is represented in a form of easy to use currency index and currency power lines which you can use to see the power of this or that currency. All you need is attach the indicator to the chart you want to trade and the indicator will show you real str
FX Power MT4 NG
Daniel Stein
5 (12)
Trading GOLD, and currencies, with the dog walk strategy  - super smart Trading GOLD, and currencies, with the breakout strategy  - super easy Visit our all-new   Stein Investments Welcome Page   to get the latest information, updates and trading strategies. FX Power MT4 NG  is the next generation of our long-time very popular currency strength meter, FX Power.  And what does this next-generation strength meter offer? Everything you have loved about the original FX Power  PLUS GOLD/XAU stre
Advanced Currency IMPULSE with ALERT
Bernhard Schweigert
4.91 (495)
CURRENTLY 31% OFF !! Best Solution for any Newbie or Expert Trader! This indicator is a unique, high quality and affordable trading tool because we have incorporated a number of proprietary features and a secret formula. With only ONE chart it gives Alerts for all 28 currency pairs. Imagine how your trading will improve because you are able to pinpoint the exact trigger point of a new trend or scalping opportunity! Built on new underlying algorithms it makes it even easier to identify and confir
Order Block Hunter
Noha Mohamed Fathy Younes Badr
5 (1)
Order block hunter indicator is the best indicator for  hunt the order blocks that area where there has been a large concentration of limit orders waiting to be executed Order blocks are identified on a chart by observing previous price action and looking for areas where the price experienced significant movement or sudden changes in direction .This indicator does that for you by using very complicated codes and helps you to take the best areas To buy and sell because it make marks at the best a
Currently 20% OFF ! Best Solution for any Newbie or Expert Trader! This dashboard software is working on 28 currency pairs plus one. It is based on 2 of our main indicators (Advanced Currency Strength 28 and Advanced Currency Impulse). It gives a great overview of the entire Forex market plus Gold or 1 indices. It shows Advanced Currency Strength values, currency speed of movement and signals for 28 Forex pairs in all (9) timeframes. Imagine how your trading will improve when you can watch the e
First of all Its worth emphasizing here that this Trading Tool is Non-Repainting Non-Redrawing and Non-Lagging Indicator Which makes it ideal for professional trading . Online course, user manual and demo. The Smart Price Action Concepts Indicator is a very powerful tool for both new and experienced traders . It packs more than 20 useful indicators into one combining advanced trading ideas like Inner Circle Trader Analysis and Smart Money Concepts Trading Strategies . This indicator focuses on
Enigmera
Ivan Stefanov
5 (4)
ENIGMERA: The core of the market (If the demo of mql5.com doesn't working and you want to try Enigmera please message me.) Introduction This indicator and trading system is a remarkable approach to the financial markets . ENIGMERA uses the fractal cycles to accurately calculate support and resistance levels. It shows the authentic accumulation phase and gives direction and targets.  A system that works whether we are in a trend or a correction.   How does it operate? ENIGMERA comprises of fol
Scalper Vault
Oleg Rodin
5 (29)
Scalper Vault is a professional scalping system which provides you with everything you need for successful scalping. This indicator is a complete trading system which can be used by forex and binary options traders. The recommended time frame is M5. The system provides you with accurate arrow signals in the direction of the trend. It also provides you with top and bottom signals and Gann market levels. The indicator provides all types of alerts including PUSH notifications. PLEASE CONTACT ME AFT
PZ Day Trading
PZ TRADING SLU
3.67 (3)
Effortless trading: non-repainting indicator for accurate price reversals Special Offer: Purchase now to receive free bonuses worth $189! (Read more for details) This indicator detects price reversals in a zig-zag fashion, using only price action analysis and a donchian channel. It has been specifically designed for short-term trading, without repainting or backpainting at all. It is a fantastic tool for shrewd traders aiming to increase the timing of their operations. [ Installation Guide | Up
Gold Channel is a volatility-based indicator, developed with a specific timing algorithm for the XAUUSD pair, which consists of finding possible corrections in the market. This indicator shows two outer lines, an inner line (retracement line) and an arrow sign, where the theory of the channel is to help identify overbought and oversold conditions in the market. The market price will generally fall between the boundaries of the channel. If prices touch or move outside the channel it is a tra
PLEASE READ THE INFO DOWN BELOW BEFORE PURCHASING THE PRODUCT! Apollo Pips PLUS SP is a unique product!  IT IS FOR THOSE WHO WANT TO GET MY NEW "APOLLO PIPS" INDICATOR PLUS "SUPER PACK" BONUS WITH ACCESS TO ALL MY TRADING INDICATORS! By purchasing the Apollo Pips PLUS SP product you're actually purchasing an absolutely new version of my Apollo Pips indicator. This version of the indicator has got an improved algorithm and an easy to use parameter which gives you the opportunity to use the indica
RelicusRoad Pro
Relicus LLC
4.73 (141)
How many times have you bought a trading indicator with great back-tests, live account performance proof with fantastic numbers and stats all over the place but after using it, you end up blowing your account? You shouldn't trust a signal by itself, you need to know why it appeared in the first place, and that's what RelicusRoad Pro does best! NOW $147 (increasing to $499 after a few updates) - UNLIMITED ACCOUNTS (PCs or MACs) **  User Manual + Strategies + Training Videos + Private Group with
Advanced Supply Demand
Bernhard Schweigert
4.9 (314)
CURRENTLY 26% OFF !! Best Solution for any Newbie or Expert Trader! This indicator is a unique, high quality and affordable trading tool because we have incorporated a number of proprietary features and a new formula. With this update, you will be able to show double timeframe zones. You will not only be able to show a higher TF but to show both, the chart TF, PLUS the higher TF: SHOWING NESTED ZONES. All Supply Demand traders will love it. :) Important Information Revealed Maximize the potenti
This indicator I use with RENKO and RangeBar candle Discover the Secret to Successful Forex Trading with Our Custom MT4 Indicator! Have you ever wondered how to achieve success in the Forex market, consistently earning profits while minimizing risk? Here is the answer you've been searching for! Allow us to introduce our proprietary MT4 indicator that will revolutionize your approach to trading. Unique Versatility Our indicator is specially designed for users who prefer Renko and Rangebar candle
XQ Indicator MetaTrader 4
Marzena Maria Szmit
3.67 (3)
Step into the realm of Forex trading with confidence and precision using XQ, a cutting-edge Forex indicator designed to elevate your trading game to unprecedented heights. Whether you're a seasoned trader or just stepping into the world of currency exchange,   XQ Forex Indicator   empowers you with the insights and signals needed to make informed trading decisions. The signal conditions are a combination of three indicators, and XQ Forex Indicator only display  medium and long-term trends . The
M1 Arrow
Oleg Rodin
4.73 (15)
M1 Arrow is an indicator which is based on natural trading principles of the market which include volatility and volume analysis. The indicator can be used with any time frame and forex pair. One easy to use parameter in the indicator will allow you to adapt the signals to any forex pair and time frame you want to trade. The Arrows DO NOT REPAINT and DO NOT LAG! The algorithm is based on the analysis of volumes and price waves using additional filters. The intelligent algorithm of the indicato
Automated Trendlines
Georgios Kalomoiropoulos
5 (17)
Trendlines  are the most essential tool of technical analysis in forex trading.  Unfortunately, most  traders don’t draw them correctly. Automated Trendlines indicator is a professional tool for serious traders that help you visualize the trending movement of the markets . There are two types of Trendlines Bullish Trendlines and Bearish Trendlines. In the uptrend, Forex trend line is drawn through the lowest swing-points of the price move. Connecting at least two "lowest lows" will create a
Break and Retest
Mohamed Hassan
4.12 (17)
This Indicator only places quality trades when the market is really in your favor with a clear break and retest. Patience is key with this price action strategy! If you want more alert signals per day, you increase the number next to the parameter called: Support & Resistance Sensitivity.  After many months of hard work and dedication, we are extremely proud to present you our  Break and Retest price action indicator created from scratch. One of the most complex indicators that we made with ove
AW Trend Predictor
AW Trading Software Limited
4.74 (39)
The combination of trend and breakdown levels in one system. An advanced indicator algorithm filters market noise, determines the trend, entry points, as well as possible exit levels. Indicator signals are recorded in a statistical module, which allows you to select the most suitable tools, showing the effectiveness of the signal history. The indicator calculates Take Profit and Stop Loss marks. Manual and instruction -> Here / MT5 version -> Here How to trade with the indicator:  Trading with T
TPSpro RFI Levels
Roman Podpora
4.83 (24)
Reversal First Impulse levels (RFI)    INSTRUCTIONS        RUS       -       ENG              R ecommended to use with an indicator   -   TPSpro  TREND PRO -  Version MT5 A key element in trading is zones or levels from which decisions to buy or sell a trading instrument are made. Despite attempts by major players to conceal their presence in the market, they inevitably leave traces. Our task was to learn how to identify these traces and interpret them correctly. Main functions: Displaying activ
Best Currency Strength Indicator
Tumelo Patrick Rakotsoane
4.6 (48)
Advanced Currency Strength Indicator The Advanced Divergence Currency Strength Indicator. Not only it breaks down all 28 forex currency pairs and calculates the strength of individual currencies across all timeframes , but, You'll be analyzing the WHOLE forex market in 1 window (In just 1 minute) . This indicator is very powerful because it reveals the true movements of the market.  It is highly recommended to  analyze charts knowing the performance of individual currencies or the countries ec
Italo Trend Indicator
Italo Santana Gomes
4.79 (38)
BUY INDICATOR AND GET EA FOR FREE AS A BONUS + SOME OTHER GIFTS! ITALO TREND INDICATOR  is the best trend indicator on the market, the Indicator works on all time-frames and assets, indicator built after 7 years of experience on forex and many other markets. You know many trend indicators around the internet are not complete, does not help, and it's difficult to trade, but the Italo Trend Indicator is different , the Italo Trend Indicator shows the signal to buy or sell, to confirm the signal t
ICT, SMC, SMART MONEY CONCEPTS, SMART MONEY, Smart Money Concept, Support and Resistance, Trend Analysis, Price Action, Market Structure, Order Blocks, BOS/CHoCH,   Breaker Blocks ,  Momentum Shift, Supply&Demand Zone/Order Blocks , Strong Imbalance, HH/LL/HL/LH,    Fair Value Gap, FVG, Invert FVG, IFVG,  Premium  &   Discount   Zones, Fibonacci Retracement, OTE, Buy Side Liquidity, Sell Side Liquidity, BSL/SSL Taken, Equal Highs & Lows, MTF Dashboard, Multiple Time Frame, BigBar, HTF OB, HTF Ma
More from author
The utility is designed to change the symbol of the current, all or selected charts, change the timeframe , as well as to synchronously move through the history of all charts (automatically or by clicking the button). The list of symbols is read from the "Market Watch" or is set manually. The color, size and position of the buttons are customizable. Synchronization of charts occurs according to the time of the first visible bar when you press the "SYNC" button or when moving the mouse/keyboard i
Mini Charts MT5
Sergey Efimenko
4.91 (23)
The indicator displays minimized charts of any symbol from any timeframe. The maximum number of displayed charts is 28. The charts can be located both in the main and bottom window. Two display modes: candles and bars. Amount of displayed data (bars and candles) and chart sizes are adjustable. To work with a mini chat, you must first put the desired indicator(s) on a regular chart, then save it as a template and apply a template for the mini chart via the appropriate parameter, for example, for
FREE
Mini Charts
Sergey Efimenko
4.31 (16)
The indicator displays minimized charts of any symbol from any timeframe. The maximum number of displayed charts is 28. The charts can be located both in the main and bottom window. Two display modes: candles and bars. Amount of displayed data (bars and candles) and chart sizes are adjustable. Parameters: Corner - display start corner (selected from the list) CandleMode - display mode: true - candles, false - bars ShowLastBid - enable/disable the last price display LastBidShiftX - last price lin
FREE
CPM Extended MT5
Sergey Efimenko
4.43 (7)
The algorithm is based on the idea of the Currency Power Meter indicator. In this version, the number of displayed values is unlimited, its code is more compact and fast, values of the current bar can be obtained through indicator buffers. What the indicator shows : a thin band and the upper number in front of the currency shows the relative strength index for the last N hours (N is set in the parameters in the variable 'Hours'), a wider band shows the daily index. The more currency pairs using
FREE
The indicator allows you to determine the current price direction and market volatility. This version of the Traders Dynamic Index (TDI) has the redrawing of the historical data eliminated, the algorithm calculation speed optimized, more external parameters for a more precise adjustments, and its functionalities extended: added the selection of the initial oscillator and the smoothing methods of the averages. Parameters: Mode Osc - estimation oscillator selection; Period Osc - the calculation
This is a linear indicator of a currency power having the ability to filter by smoothing values. It shows the current power of selected currencies (the maximum number is 8), as well as historical values. Calculation depends on the selected chart timeframe the indicator is launched at. The indicator displays data as lines for all currencies or as a histogram for the current currency pair. The intersection of the currency strength indices for the current currency pair is additionally displayed as
The uniqueness of this indicator lies in the volume accounting algorithm: accumulation occurs directly for the selected period without reference to the beginning of the day. The last bars can be excluded from the calculation, then the current data will have less influence on the significant levels (volumes) formed earlier. For a more accurate calculation, data from the M1 graph is used by default. The step of distribution of price volumes is regulated. By default, the right border of the display
CPM Extended
Sergey Efimenko
4.62 (21)
The algorithm is based on the idea of the Currency Power Meter indicator. In this version, the number of displayed values is unlimited, its code is more compact and fast, values of the current bar can be obtained through indicator buffers. What the indicator shows : a thin band and the upper number in front of the currency shows the relative strength index for the last N hours (N is set in the parameters in the variable 'Hours'), a wider band shows the daily index. The more currency pairs using
FREE
Extended version of the "Keltner Channel" indicator. This is an analytical tool that allows you to determine the ratio of the price position relative to its volatility. You can use 26 types of moving average and 11 price options to calculate the middle line of the indicator. Configurable alerts will notify you when the price touches the upper or lower border of the channel. Available average types: Simple Moving Average, Exponential Moving Average, Wilder Exponential Moving Average, Linear Weig
This is an MTF indicator of support and resistance levels based on Advanced ZigZag Dynamic and/or Extended Fractals indicator extremums with price labels (can be disabled). More higher TFs can be selected for MTF mode. By default, the levels are generated based on ZigZag indicator dots. Fractals indicator dots can also be used together with ZigZag or instead of it. In order to simplify the use and save CPU time, calculation is performed once per each bar at its opening. Parameters: ForcedTF - ch
This is a linear indicator of a currency power having the ability to filter by smoothing values. It shows the current power of selected currencies (the maximum number is 8), as well as historical values. Calculation depends on the selected chart timeframe the indicator is launched at. The indicator displays data as lines for all currencies or as a histogram for the current currency pair. The intersection of the currency strength indices for the current currency pair is additionally displayed as
The indicator shows harmonic patterns on the chart without repainting with the minimum possible lag. The search for indicator tops is based on the wave principle of price analysis. Advanced settings allow you to choose parameters for your trading style. At the opening of a candle (bar), when a new pattern is formed, an arrow of the probable direction of the price movement is fixed, which remains unchanged. The indicator recognizes the following patterns and their varieties: ABCD, Gartley (Butter
The indicator allows you to determine the current price direction and market volatility. This version of the Traders Dynamic Index  (TDI) has the redrawing of the historical data eliminated, the algorithm calculation speed optimized, more external parameters for a more precise adjustments, and its functionalities extended: added the selection of the initial oscillator and the smoothing methods of the averages. Parameters: Mode Osc - estimation oscillator selection; Period Osc - the calculation p
Advanced Power Trend
Sergey Efimenko
5 (2)
Unique "scalping" trend indicator with the feature of multi-layered smoothing of the resulting lines and a wide selection of parameters. It helps determine a probable change in the trend or a correction virtually near the very beginning of the movement. The toggled intersection arrows are fixed and appear at the opening of a new bar, but, with enough experience, it is possible to look for entry opportunities as soon as the indicator lines intersect at the unfinished bar. The signal appearance li
The uniqueness of this indicator lies in the volume accounting algorithm: accumulation occurs directly for the selected period without reference to the beginning of the day. The last bars can be excluded from the calculation, then the current data will have less influence on the significant levels (volumes) formed earlier. For a more accurate calculation, data from the M1 graph is used by default. The step of distribution of price volumes is regulated. By default, the right border of the display
True SSRC nrp
Sergey Efimenko
5 (2)
The indicator shows (optional): Spearman's rank correlation coefficient, Pearson's linear correlation coefficient, Kendall's rank correlation coefficient, and Fechner's sign correlation coefficient. This oscillator shows the points of possible market reversal when the price goes beyond the overbought and oversold levels. There are 4 methods for additional filtering of the obtained values: simple, exponential, smoothed, linearly weighted. After the bar is closed, the values are fixed and not rep
If you trade by levels, then this indicator is for you. The indicator displays support and resistance levels for the selected timeframes, additionally showing how many points to the nearest levels, as well as between which levels the current price is in the form of a color scale and percentages. Location anywhere on the chart, the ability to scale, the calculation offset taking into account the hourly difference of your broker, the choice of colors and other parameters will allow you to cus
This is an extended version of Keltner channel. You can use 21 types of Moving Average and 11 methods of calculating the indicator's center line. Moving Average types: Simple Moving Average, Exponential Moving Average, Wilder Exponential Moving Average, Linear Weighted Moving Average, Sine Weighted Moving Average, Triangular Moving Average, Least Square Moving Average (or EPMA, Linear Regression Line), Smoothed Moving Average, Hull Moving Average by Alan Hull, Zero-Lag Exponential Moving Average
The indicator displays harmonic patterns on the chart based on Dynamic ZigZag ( https://www.mql5.com/en/market/product/5357 ) and is almost a complete analog of one of the versions of well-known korHarmonics. The indicator recognizes the following patterns and their varieties: ABCD, Gartley (Butterfly, Crab, Bat), 3Drives, 5-0, Batman, SHS, One2One, Camel, Triangles, WXY, Fibo and Vibrations. Only display of ABCD and Gartley patterns is enabled in the settings by default. The reverse line allows
This is an MTF indicator of support and resistance levels based on Advanced ZigZag Dynamic and/or Extended Fractals indicator extremums with price labels (can be disabled). More higher TFs can be selected for MTF mode. By default, the levels are generated based on ZigZag indicator dots. Fractals indicator dots can also be used together with ZigZag or instead of it. In order to simplify the use and save CPU time, calculation is performed once per each bar at its opening. Parameters: ForcedTF - ch
Unique "scalping" trend indicator with the feature of multi-layered smoothing of the resulting lines and a wide selection of parameters. It helps determine a probable change in the trend or a correction virtually near the very beginning of the movement. The toggled intersection arrows are fixed and appear at the opening of a new bar, but, with enough experience, it is possible to look for entry opportunities as soon as the indicator lines intersect at the unfinished bar. The signal appearance l
The indicator shows harmonic patterns on the chart without repainting with the minimum possible lag. The search for indicator tops is based on the wave principle of price analysis. Advanced settings allow you to choose parameters for your trading style. At the opening of a candle (bar), when a new pattern is formed, an arrow of the probable direction of the price movement is fixed, which remains unchanged. The indicator recognizes the following patterns and their varieties: ABCD, Gartley (Butter
The utility is designed to   change the symbol   of the current, all or selected charts,   change the timeframe , as well as to   synchronously move through the history   of all charts (automatically or by clicking the button). The list of symbols is read from the "Market Watch" or is set manually. The color, size and position of the buttons are customizable. Synchronization of charts occurs according to the time of the first visible bar when you press the "SYNC" button or when moving the mouse/
The indicator shows (optional): Spearman's rank correlation coefficient, Pearson's linear correlation coefficient, Kendall's rank correlation coefficient, and Fechner's sign correlation coefficient. This oscillator shows the points of possible market reversal when the price goes beyond the overbought and oversold levels. There are 4 methods for additional filtering of the obtained values: simple, exponential, smoothed, linearly weighted. After the bar is closed, the values are fixed and not rep
If you trade by levels, then this indicator is for you. The indicator displays support and resistance levels for the selected timeframes, additionally showing how many points to the nearest levels, as well as between which levels the current price is in the form of a color scale and percentages. Location anywhere on the chart, the ability to scale, the calculation offset taking into account the hourly difference of your broker, the choice of colors and other parameters will allow you to cus
Filter:
No reviews
Reply to review
Version 1.4 2020.07.22
The code was optimized for the current version of the terminal.
Version 1.3 2015.11.02
Updated calculation for drawing Fibo levels for Gartley patterns
Version 1.2 2015.07.28
Changed calculation of a shift for Fibo levels of the ABCD patterns
Version 1.1 2015.06.25
Added alert display when ZigZag changes direction.