Envelopes Grid
- Indicators
- Dominik Mandok
- Version: 1.1
- Updated: 30 November 2021
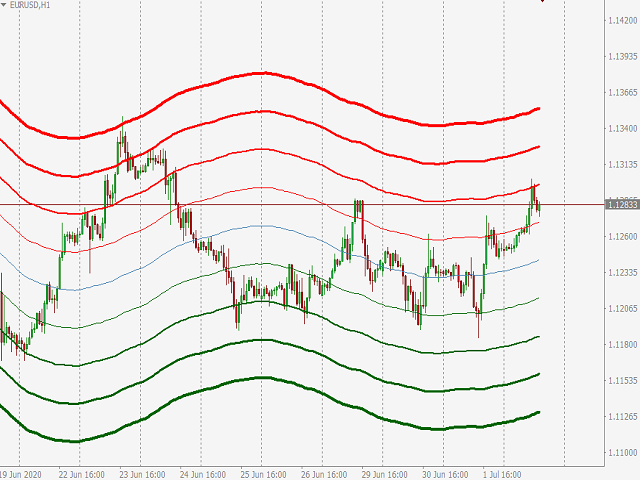
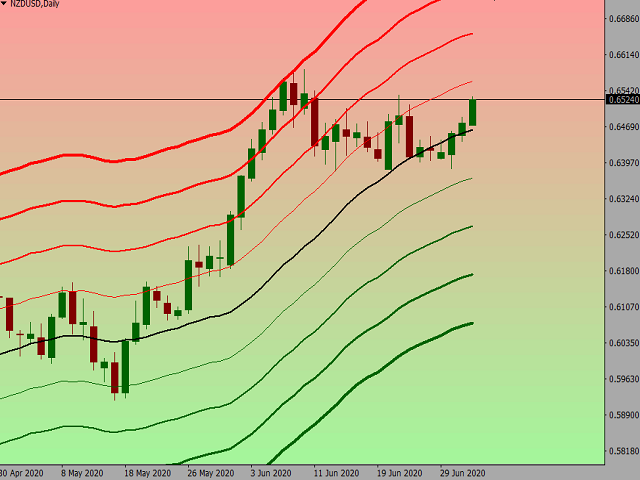
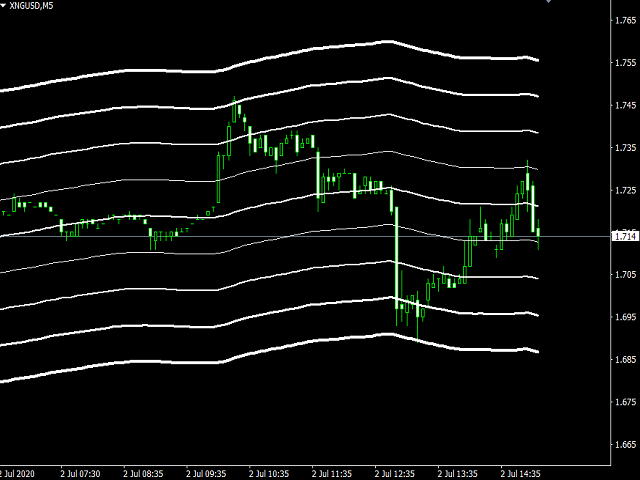
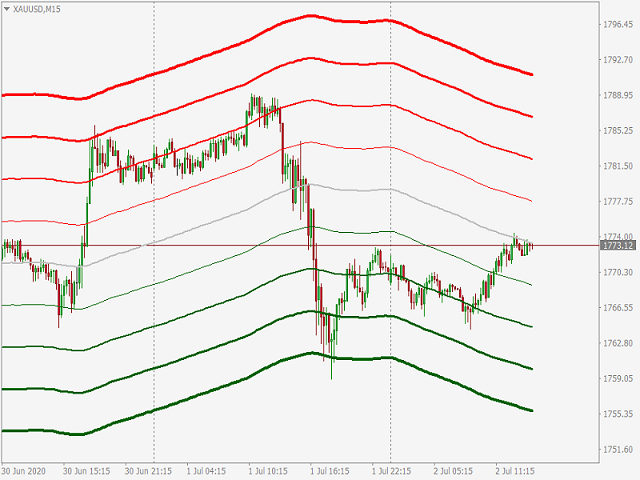
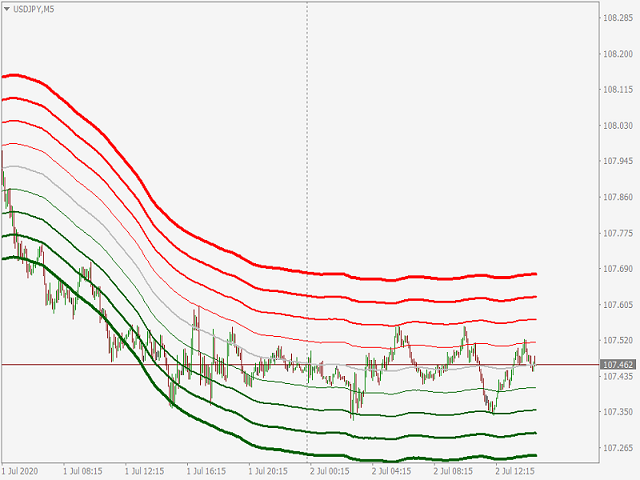
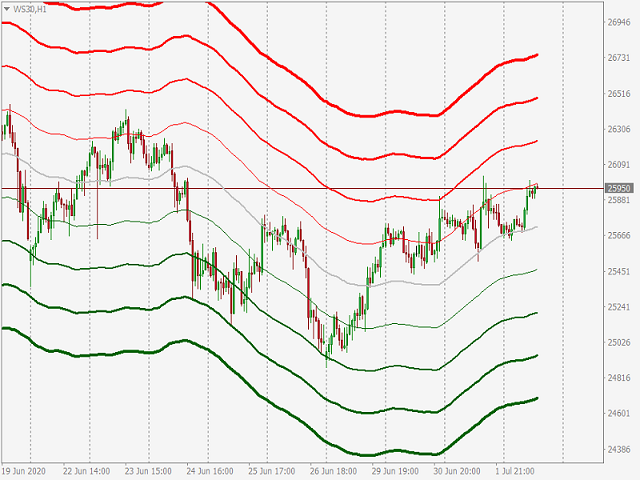
It's a simple but useful tool for creating a grid based on Envelopes.
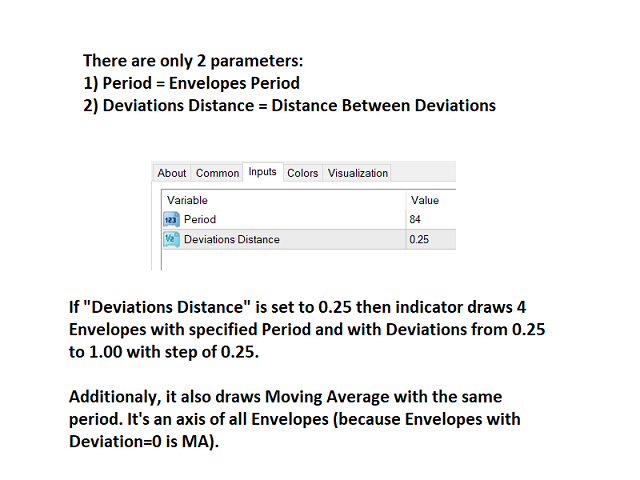
Only 2 parameters can be set:
1) "Period" - the period of all visible Envelopes (i.e. 4) and 1 Moving Average (Envelopes axis),
2) "Deviations Distance" - the distance between Envelopes.
Naturally, the colors of all 9 lines can be changed as desired.
It works with everything that is available in your Market Watch.
Good luck!

I think it is one of the few tools that can make someone real Trader!