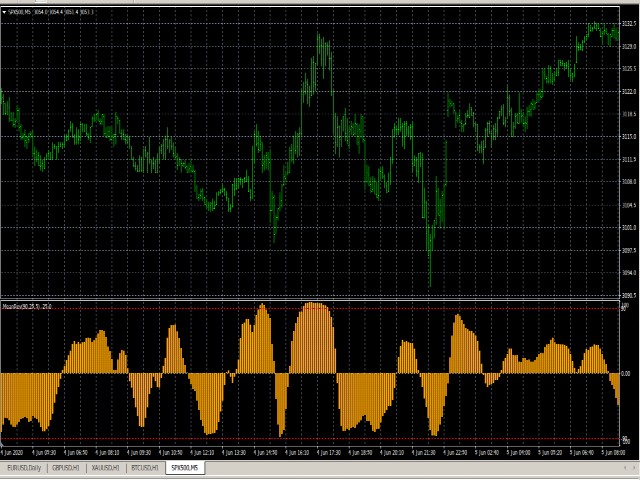
Mean Reversion Probability
- Indicators
- Mert Candar
- Version: 1.0
- Activations: 5
Mean Reversion Probability indicator is a tool based on a mathematical theory of mean reversion. As the markets very often shows the behavior of diverging from its mean, up to a certain distance, and then start to converge its mean again. This is a very well known phenomenon in stochastic processes and the price series is also a stochastic variable so we apply certain mathematical and statistical procedures to estimate the turning point.
Using Mean Reversion indicator, traders could potentially:
- identify the turning points of the price, very similar to overbought and oversold levels
- identify the start of a new trend, either up or down.
Fundamentally, this indicator answers the question of "Is the price significantly far away from its mean?" so that it could start to get close. In order to answer this question, we made particular statistical distribution assumptions that is accepted very widely in financial studies.
- DPeriod: The number of candles to look-back.
- FastPeriod: The moving average period for fast movements.
- SlowPeriod: The moving average period for trends.
- Scale: Tolerance, higher value (> 1) results in a less number of signals and vice versa.
- NIter: Number of iterations for numerical integral calculation, higher values are more accuracte but computationally expensive.
There are two important levels,
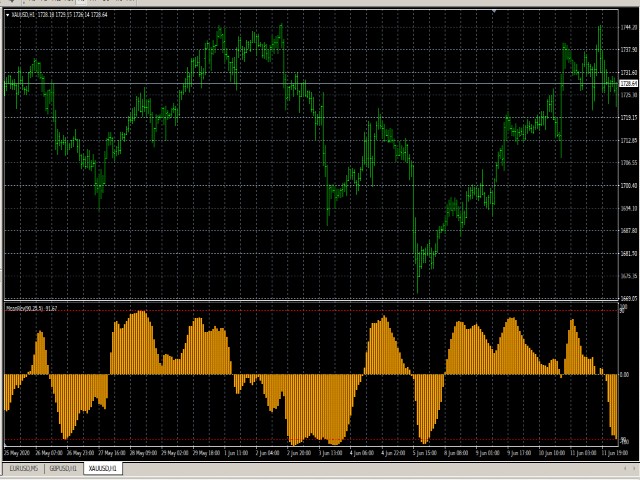
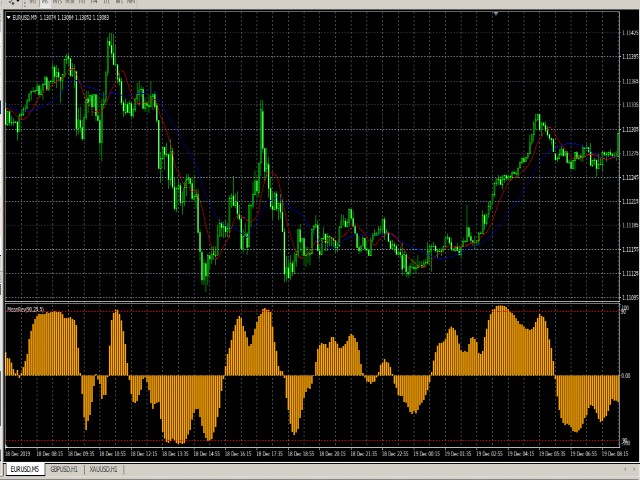
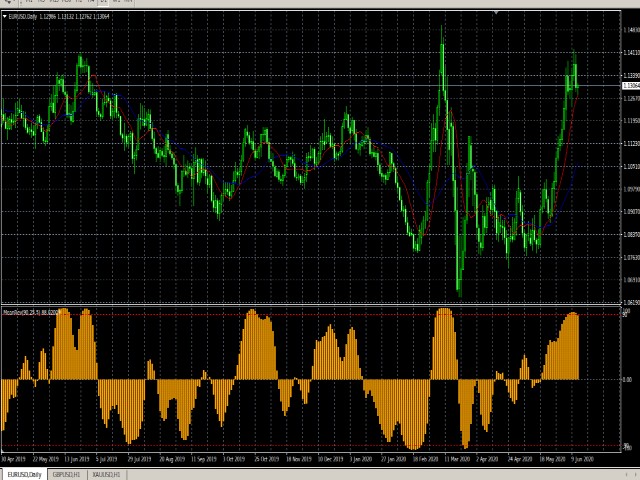
- +90, means that the price have been significantly higher from the mean so it may start to decrease.
- -90, means that the price have been significantly lower from the mean so it may start to increase.
