Seconds Chart MT5
- Utilities
- Boris Sedov
- Version: 2.23
- Updated: 6 March 2025
- Activations: 5
Seconds Chart is a unique tool for creating second-based charts in MetaTrader 5.
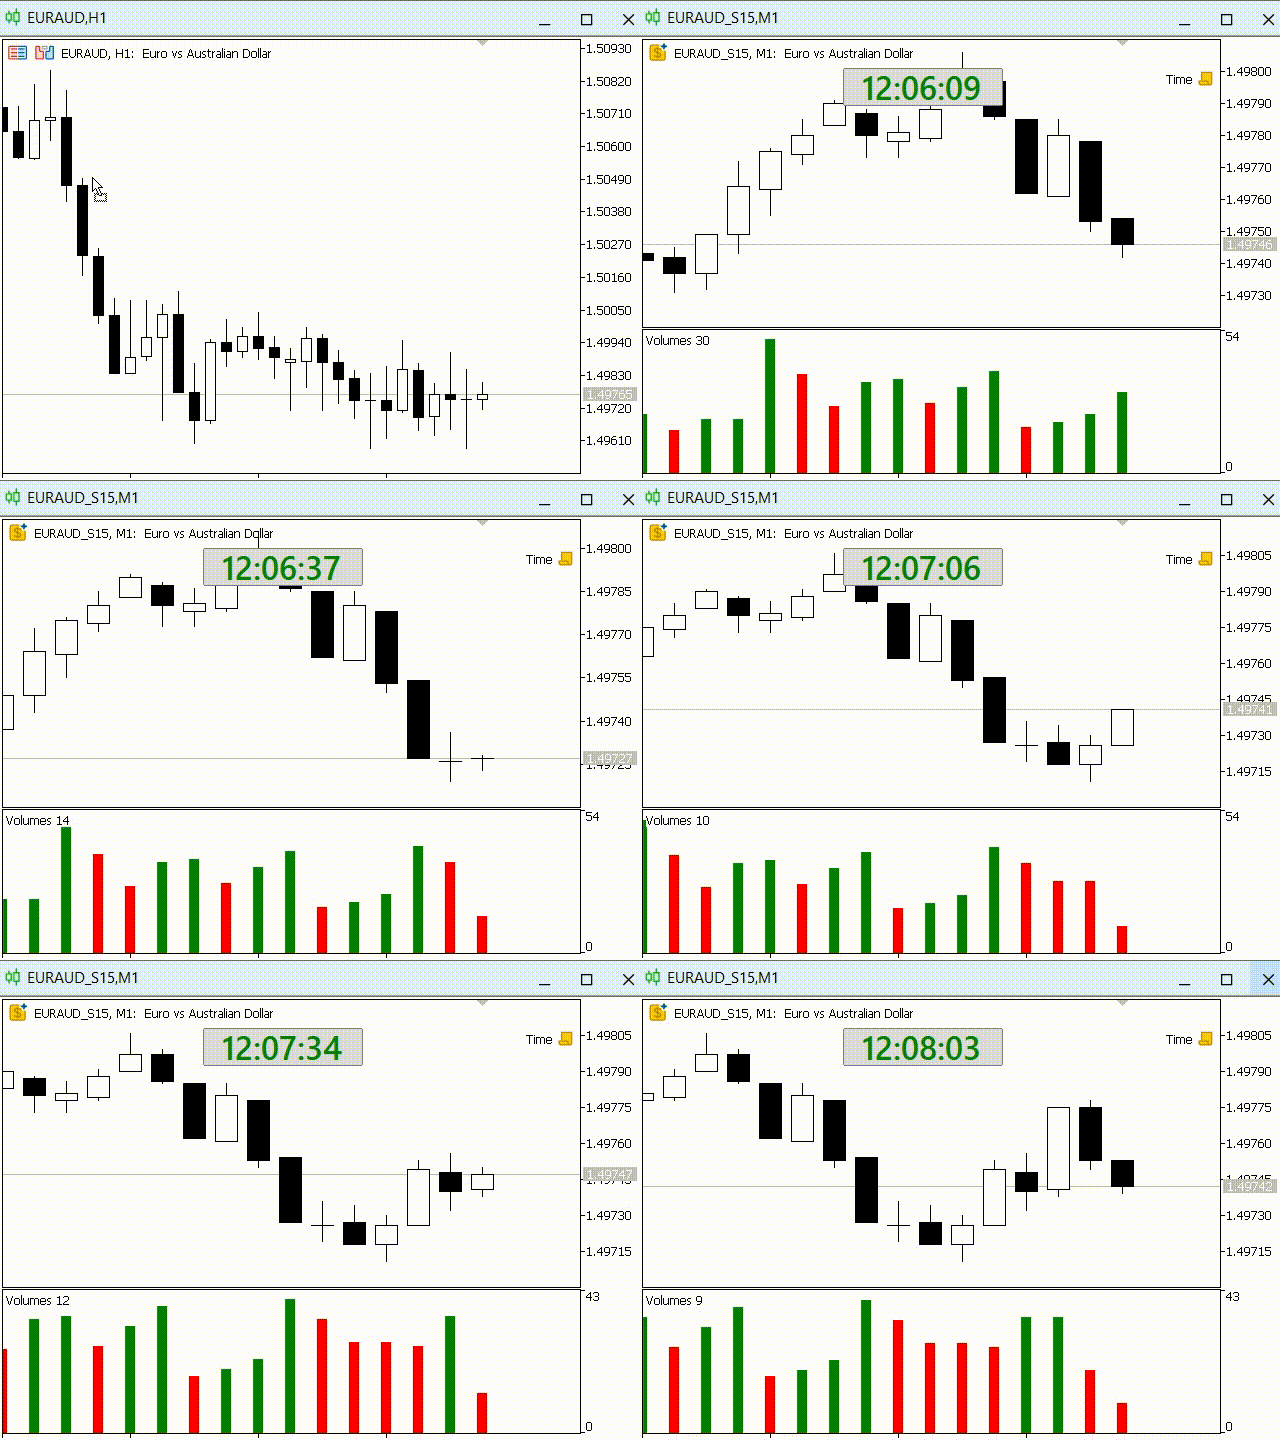
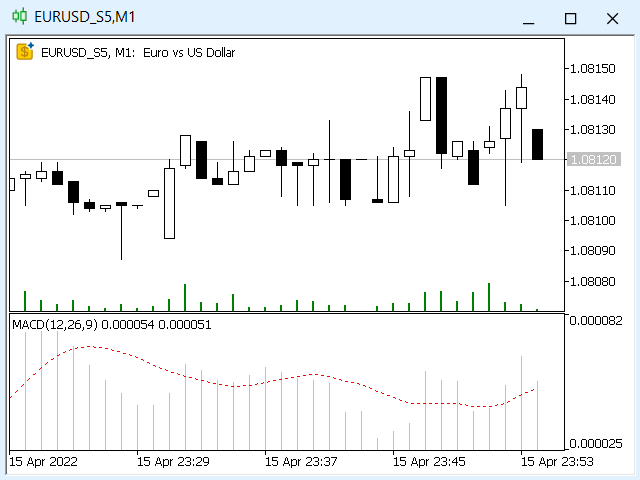
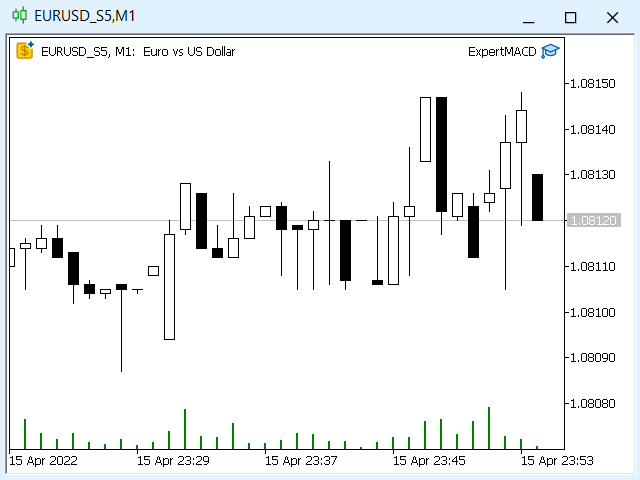
With Seconds Chart, you can construct charts with timeframes set in seconds, providing unparalleled flexibility and precision in analysis that is unavailable with standard minute or hourly charts. For example, the S15 timeframe indicates a chart with candles lasting 15 seconds. You can use any indicators, Expert Advisors (EAs), and scripts, operating as conveniently as with standard charts.
Unlike standard tools, Seconds Chart allows you to operate at ultra-short timeframes with high accuracy and without delays.
Advantages of Seconds Chart
-
Supports charts with timeframes ranging from 1 to 900 seconds.
-
Instant loading of historical data due to an integrated tick database.
-
Real-time data updates, without delays or lags.
-
Ability to create multiple second-based charts simultaneously.
Ideal Use Cases for Seconds Chart
-
Scalping and high-frequency trading.
-
Precise trade entries and exits.
-
Testing trading strategies on short timeframes.
Timeframe Settings
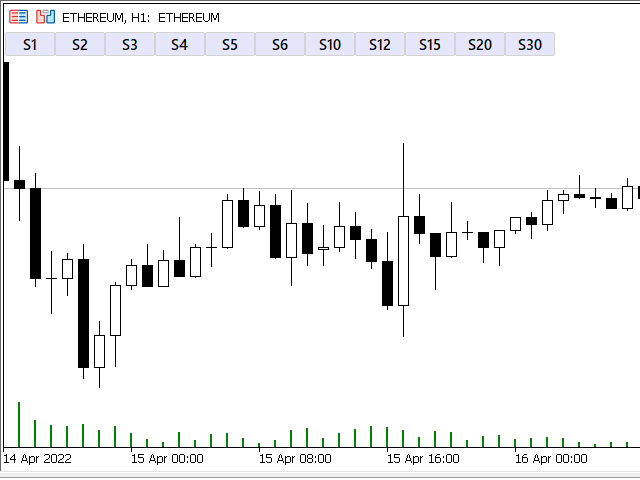
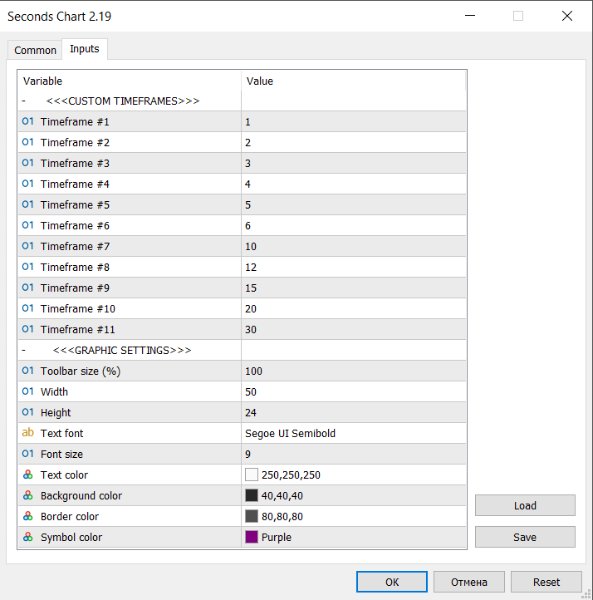
Default settings include the following timeframes: S1, S2, S3, S4, S5, S6, S10, S12, S15, S20, S30.
You can easily customize your set of second-based timeframes by listing values from 1 to 900 seconds in ascending order without repetitions.
Additional Free Tools
-
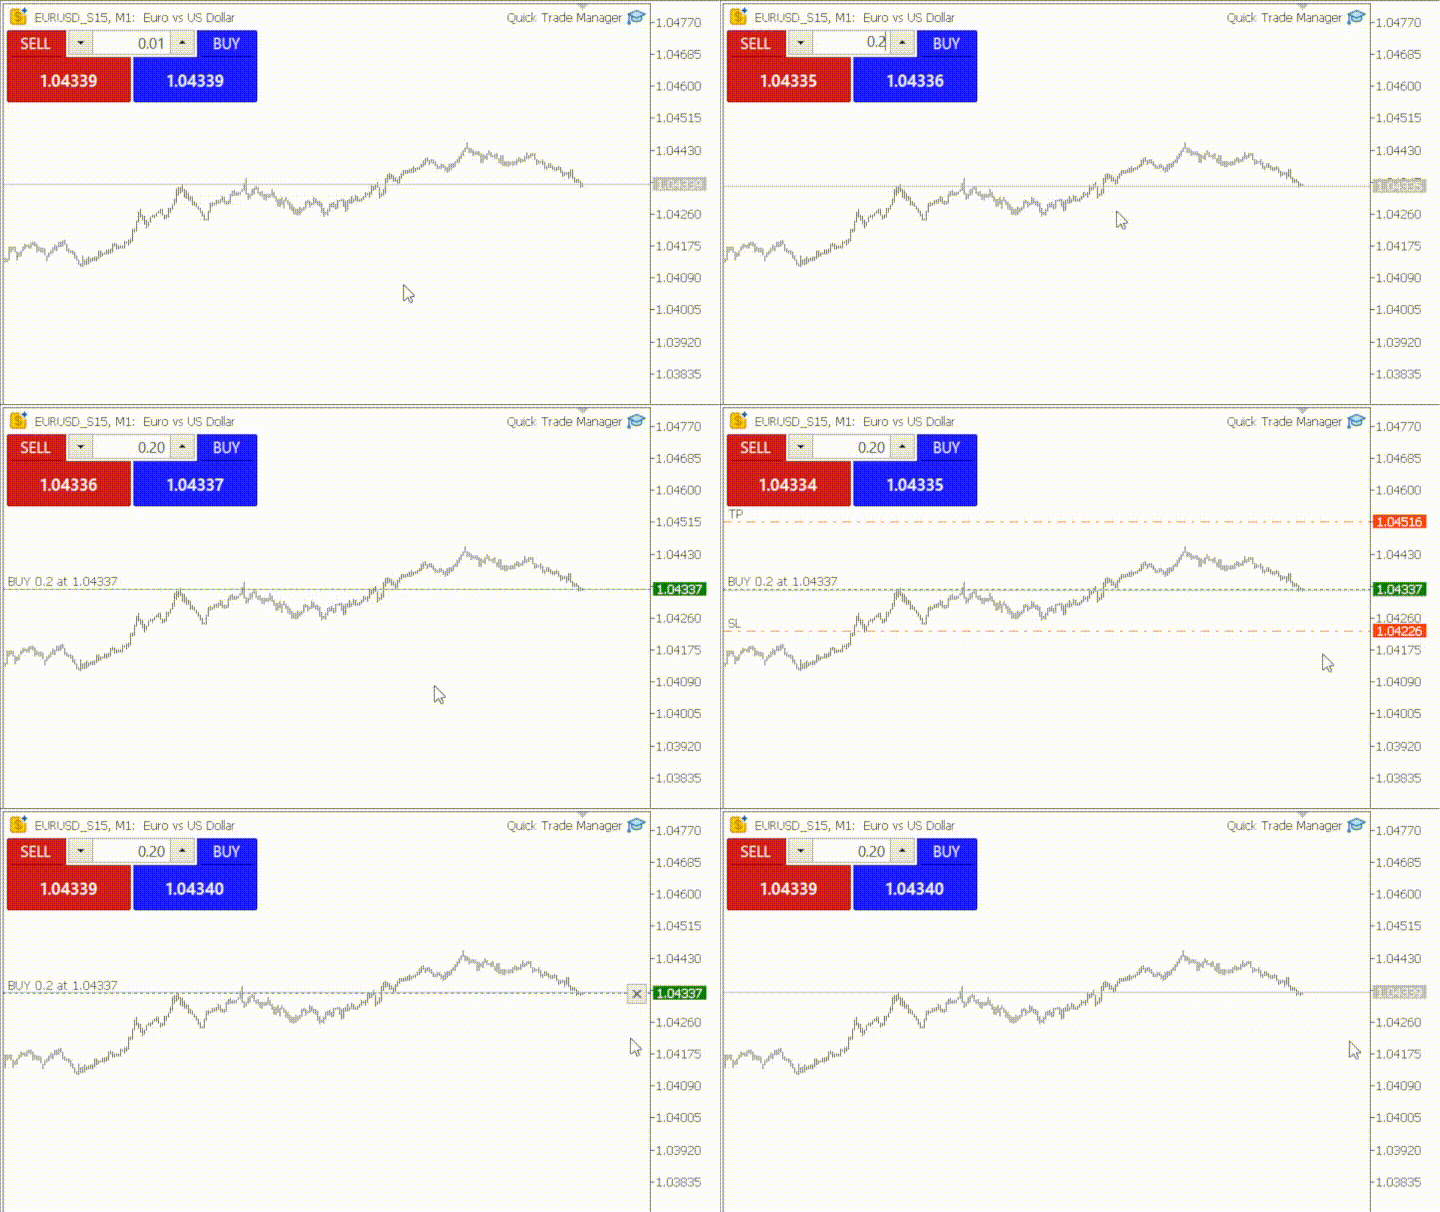
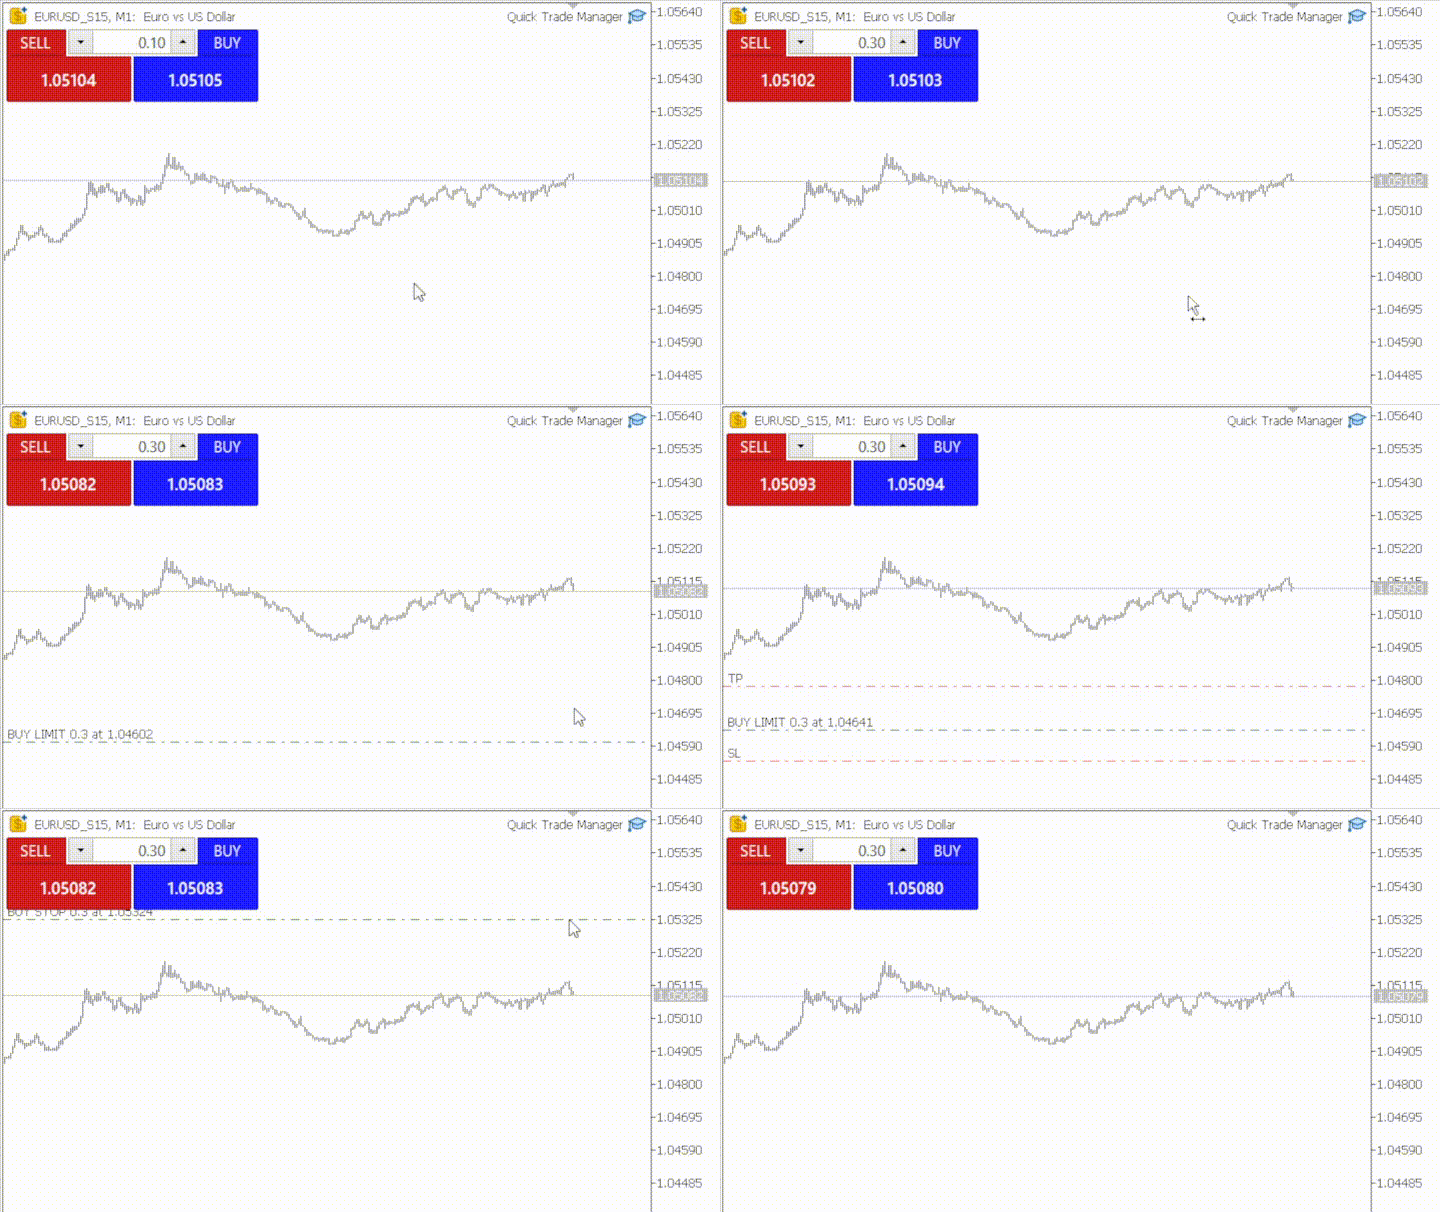
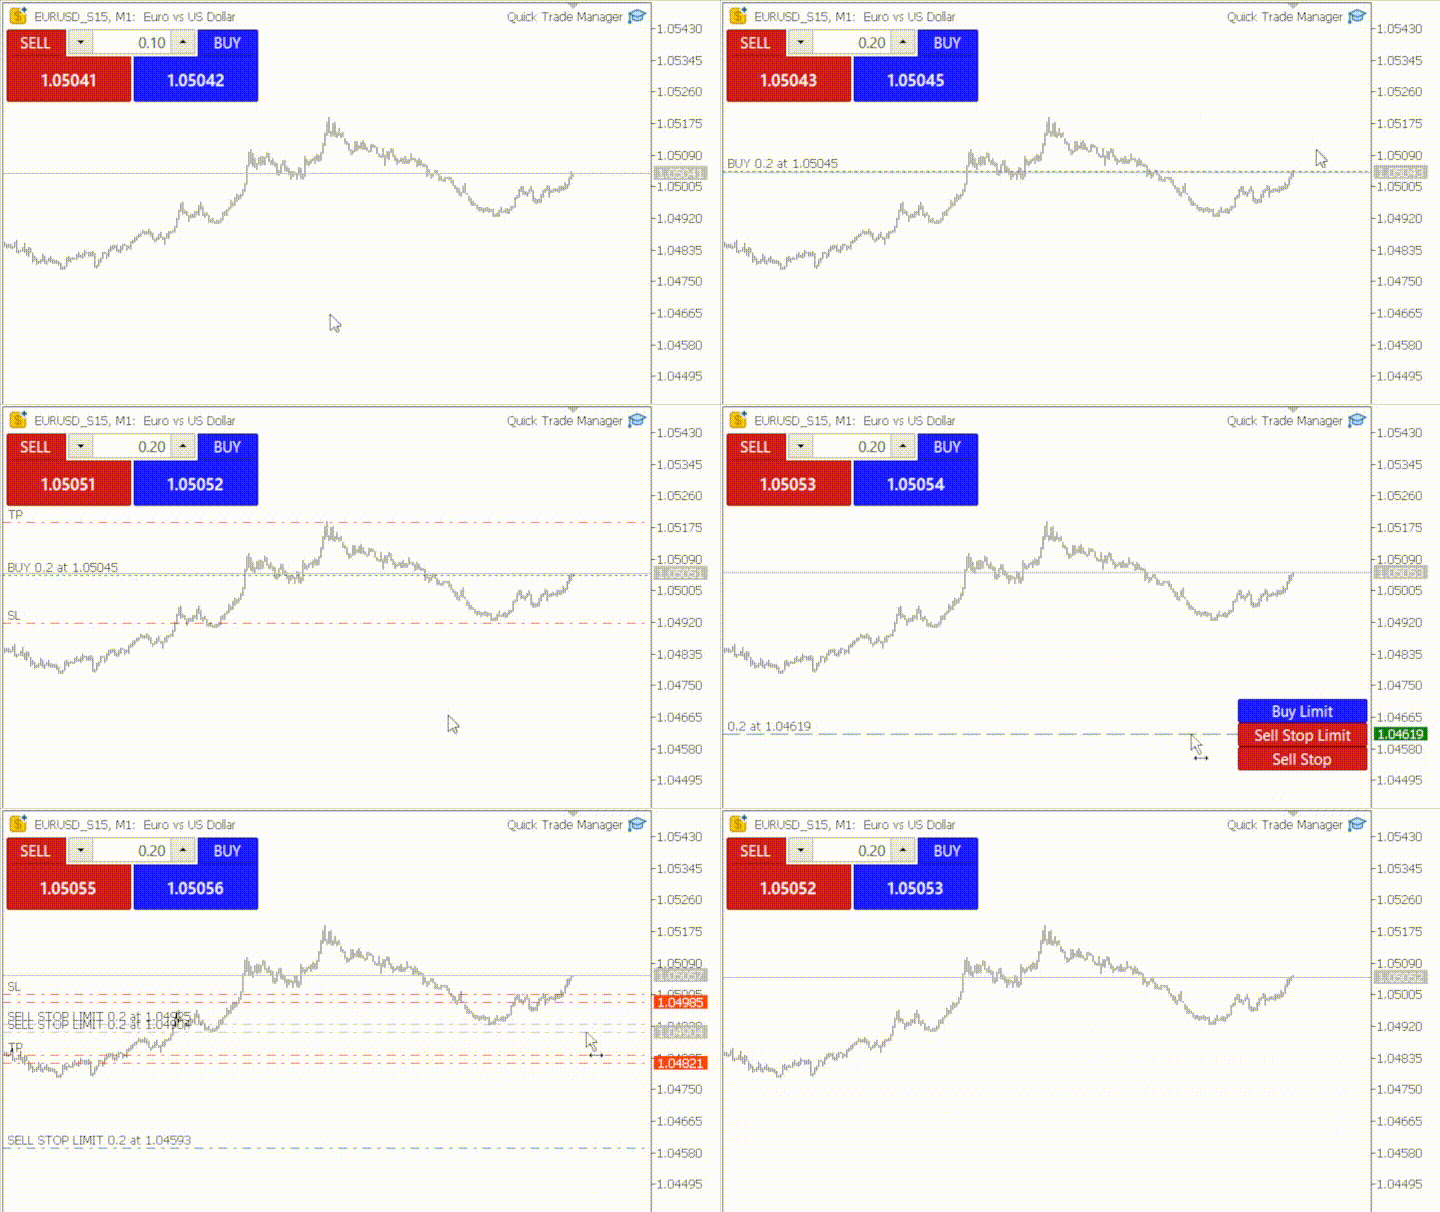
Quick Trade Manager — convenient trade manager for second-based charts.
-
Chart Service — display of trading levels.
-
Exact Time — precise opening time for any candle.
-
Exact Countdown Timer — countdown timer to the close of the current candle and the start of a new one.
Customizable Parameters
-
Timeframes: set required seconds.
-
Toolbar size (%): scale the interface button size (default 100%).
-
Graphic settings: adjust graphical display according to your preferences.
How to Start Using Seconds Chart
-
Open the "Navigator" window.
-
Locate Seconds Chart and drag it onto any open chart (timeframe does not matter).
-
Select the desired second-based timeframe by clicking the corresponding button on the control panel.
Seconds Chart is a simple, fast, and reliable tool for professional trading on ultra-short time intervals!
























バイナリーオプションでの手法作りのために活用しています。 良い製品です。 ありがとうございます。