My Trade History PRO
- Utilities
- Bernhard Schweigert
- Version: 2.7
- Updated: 6 July 2024
- Activations: 5
CURRENTLY 20% OFF !!
Best Solution for any Newbie or Expert Trader!
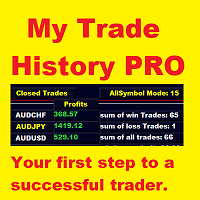
Review your trades is the first step to a successful trader.
- Successful traders have a habit of regularly reviewing their trading performance.
- This tool will help you to do just that.
- The review process will be most effective with this tool to track your trading.
- Analyse your manual trades or the trades of your EA.
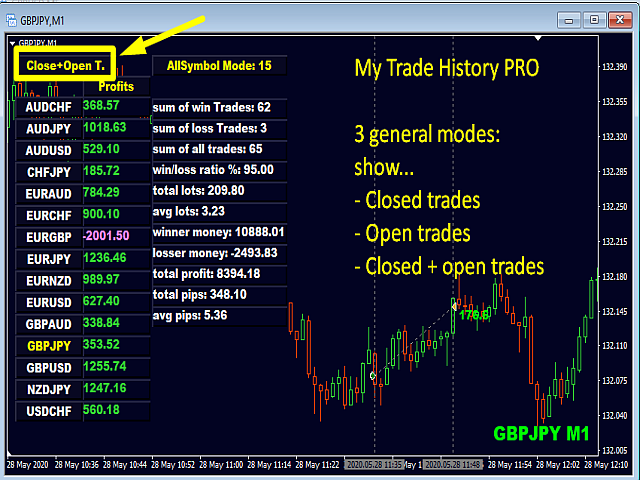
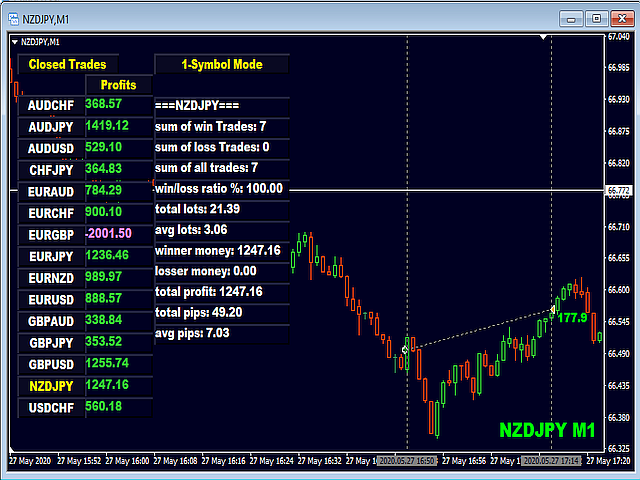
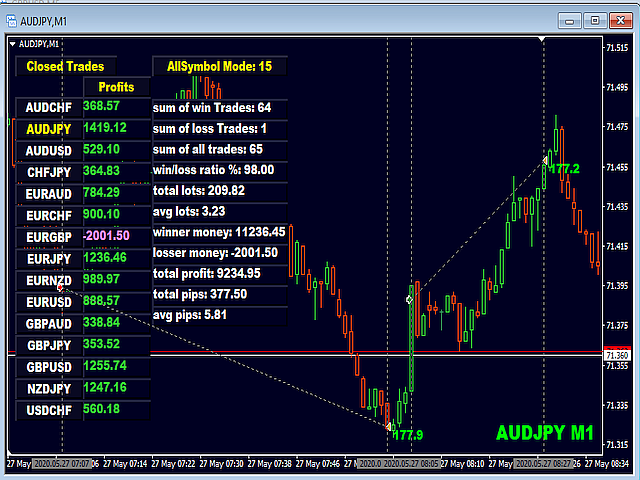
Use the 3 general view. To switch between just click on the button.
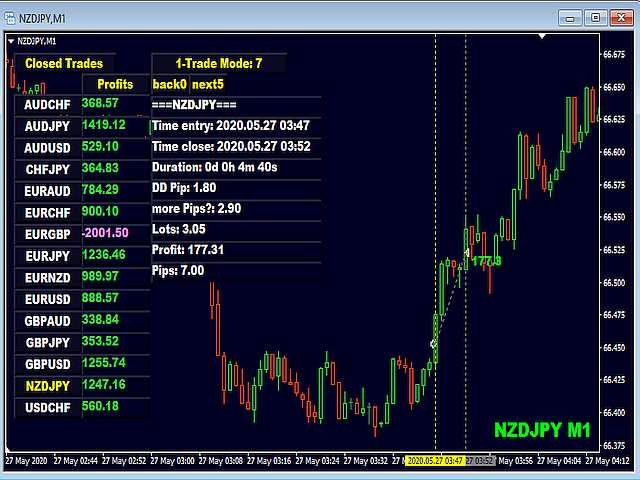
- Closed Trades
- Open Trades
- Close+Open Trades
All trades will be listed for each symbol. To go to another symbol just click on the symbols name button.
Use Alert for newly opened and closing trades. Very useful to watch your open trades. It might be initiated by EA, signal or manually.
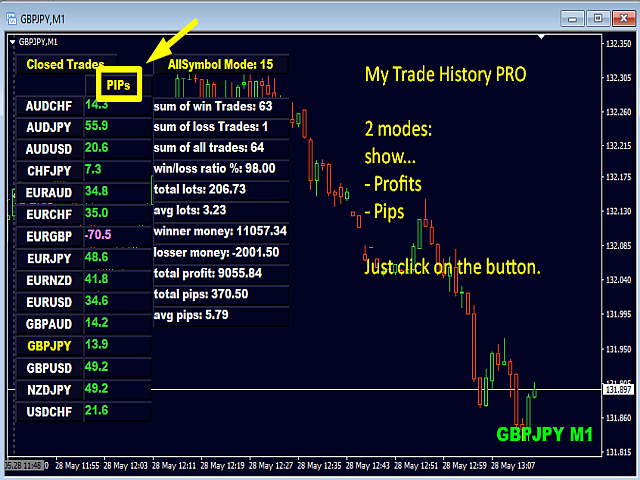
To switch the results for Profits or PIPs, just click on the button.
- Profits
- PIPs
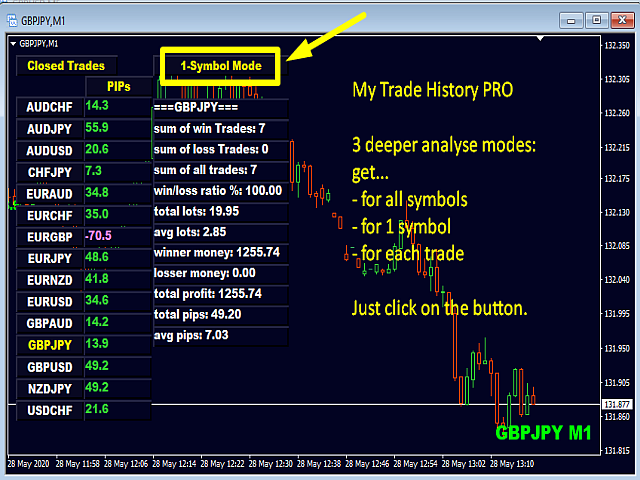
Then switch the 3 analyse type. Just click on the button.
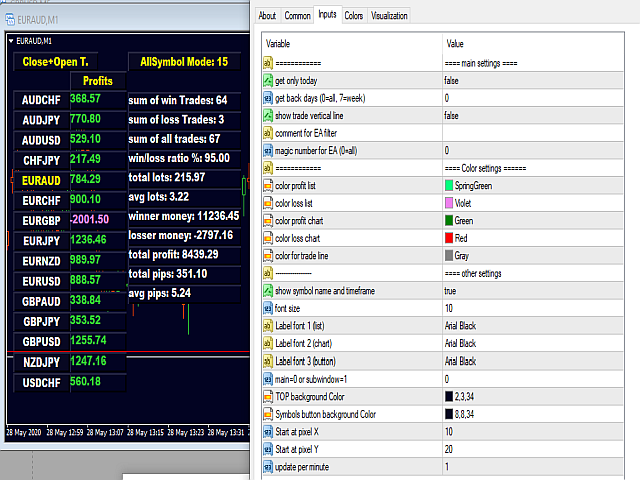
- All Symbol Mode
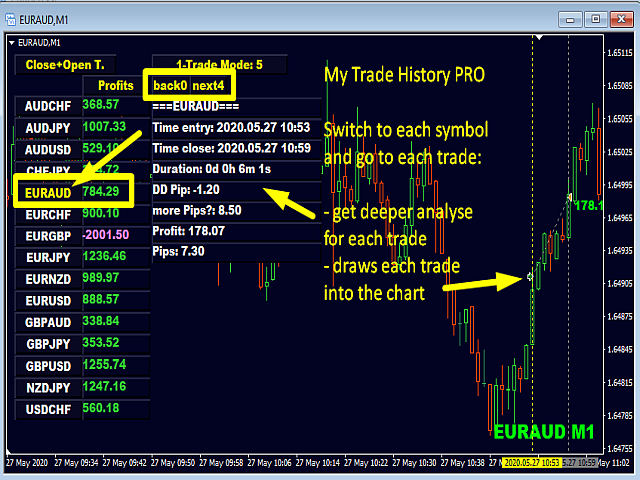
- 1-Symbol Mode
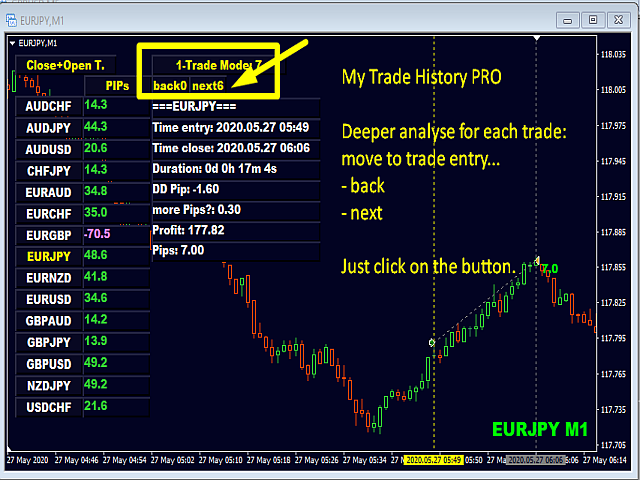
- 1-Trade Mode
In use of All Symbol and 1-Symbol Mode will list its special analytics.
In use of 1-Trade Mode click on the button back/next to move the chart to each trade entry. it will list its special trade analytic for that specific trade.
- back
- next
=== main settings
- get only today | A quick check for today trades.
- get back days (0=all, 7=week) | Enter the number of days you want to show.
- comment for EA filter | Enter a comment of your EA.
- magic number for EA (0=all) | Enter a magic number of your EA.
=== Alert settings
- Alert opening trades (use for EA or signal) | Alert newly opened trades. It might be initiated by EA, signal or manually.
- Alert closing trades (use for all) | Alert closing trades. Very useful to watch your open trades. It might be initiated by EA, signal or manually.
=== Color settings
You know how to use it.
=== other settings
- show symbol name and timeframe | A quick note on chart.
- font size | Edit for different display/screens
- Label font 1 (list) | Use "Arial" for smaller font.
- Label font 2 (chart)
- Label font 3 (button)
- main=0 or subwindow=1 | Use a number to move it into a subwindow.
- Start at pixel X | position to start
- Start at pixel Y
- Scroll number of rows list | Scroll the list up and down if the chart is full. An arrow will appear to do that.
Reach your goals and become a better trader.
I will always help you if you have any questions.
I wish you many green pips in the future.
Best Regards, Bernhard

































Nice tool :) Could you please add some color changes when it's in Profit or lost also onto total profit and total pips ? :)
And also can make an parameter to let me changes the objectcreate upper how many pips to the price ?
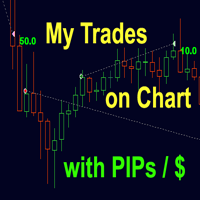
The p/l on the chart shows inside those bars :D
little changes can change the world :D Many thanks for good tools